
Fig. 4.
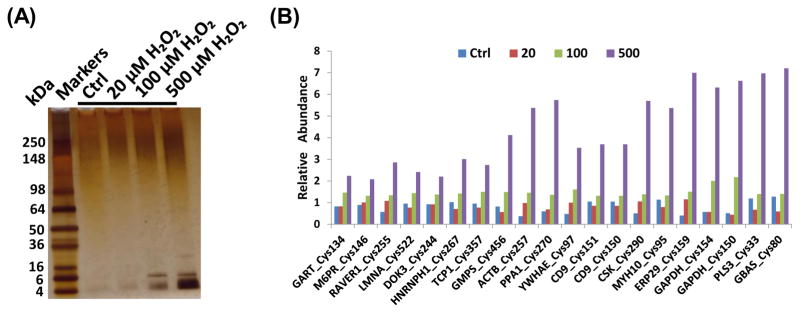
(A) Silver-staining image of SDS-PAGE of enriched Cys-peptides; (B) Selected Cys-sites showing increased levels of SSG modifications in response to H2O2 treatments. The treatment concentrations of H2O2 were in μM.
Official websites use .gov
A
.gov website belongs to an official
government organization in the United States.
Secure .gov websites use HTTPS
A lock (
) or https:// means you've safely
connected to the .gov website. Share sensitive
information only on official, secure websites.
(A) Silver-staining image of SDS-PAGE of enriched Cys-peptides; (B) Selected Cys-sites showing increased levels of SSG modifications in response to H2O2 treatments. The treatment concentrations of H2O2 were in μM.