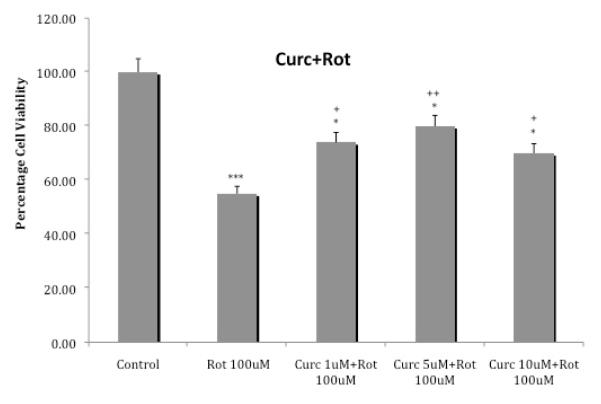
Fig. 4.
Effects of various concentrations of curcumin on cellular toxicity induced by 100 uM rotenone. Cells were exposed for 24 h and cell viability was determined by MTT assay. Values represent mean ± SEM of five independent experiments, *p<0.05, ***p<0.001 compared to control. +p<0.05, ++p<0.01 compared to rotenone.

