
Fig. 2.
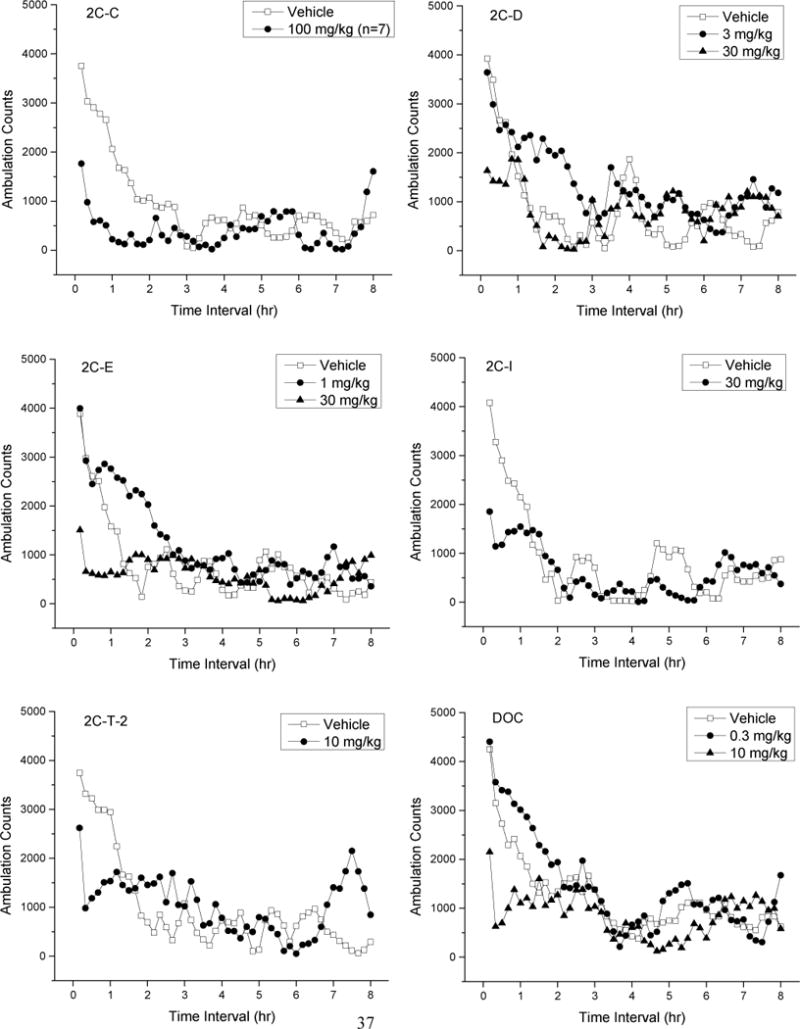
Average horizontal activity counts/10 min (ambulation counts) as a function of time (0–8 hr) and dose of test compound. Data for the vehicle and the dose which produced peak depressant effects are shown in each panel. 2C-D and DOC also produced stimulant effects, and data for the dose which produced peak stimulant effects are also shown. N=8 for each treatment.