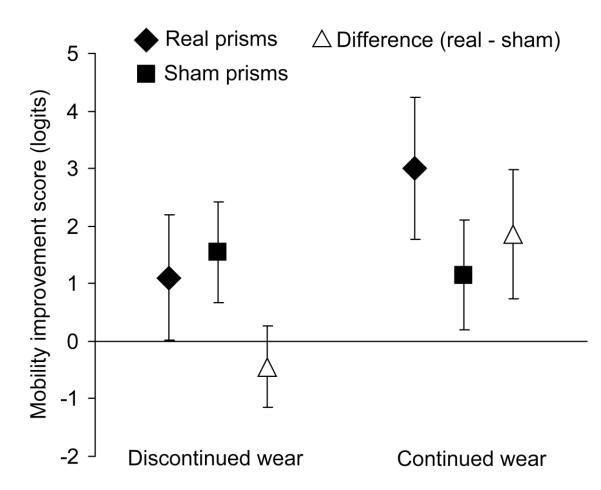
Figure 4. Mean mobility improvement scores for real and sham prism glasses.
Participants who continued prism wear reported significantly more improvement with real than sham glasses. Mobility scores are in logit units: more positive values represent greater improvement. For real and sham prisms, error bars are 95% confidence intervals of the mean scores. For the difference between real and sham, errors bars are 95% confidence intervals of the mean paired differences.

