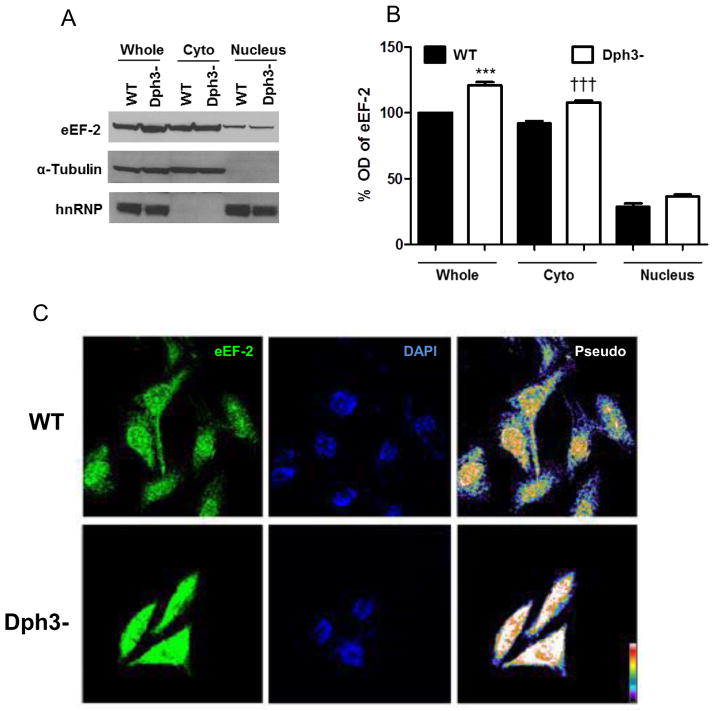
Figure 2.
Levels of eEF-2 are elevated in diphthamide-deficient cells. A. Subcellular fractionation and immunoblot analysis the eEF2 levels. α-tubulin and hnRNP were used as cytoplasmic and nuclear markers. B. Optical density of the eEF2 bands were normalized to a control (α-tubulin or hnRNP). Values are the mean and SEM of 4 experiments. ***p< 0.001 versus the value for whole cell extracts from wild-type cells. †††p<0.001 versus the value for cytoplasmic extracts from wild-type cells. C. Confocal localization of eEF2 in wild-type and diphthamide-deficient cells by immunofluorescence (green); nuclei were stained with 4′,6-diamidino-2-phenylindole (blue). eEF2 integrated intensity (pixel/ μm2): WT 100 ± 5.12% n=47 cells; Dph3− 136.4 ± 8.3% n=43 cells; t test p=0.00028.

