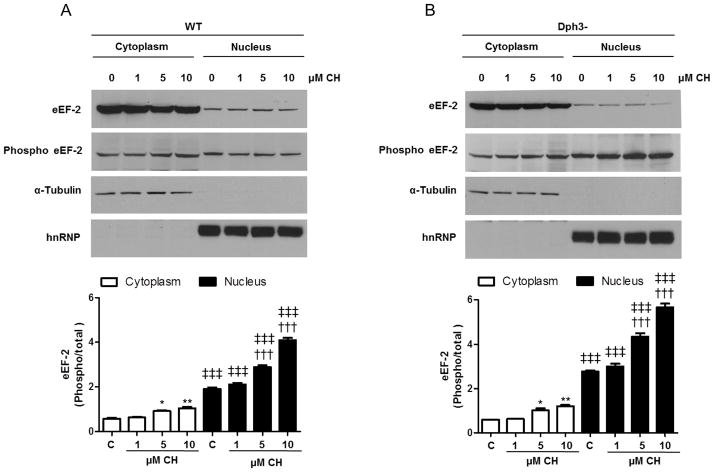
Figure 3.
The nuclear ratio of phosphorylated to total eEF2 is higher in diphthamide-deficient cells. A and B. Subcellular fractionation and immunoblot analysis for total and phosphorylated eEF2 were performed on WT cells (A) and diphthamide-deficient cells (B), treated with CH for 3 h. α-tubulin and hnRNP were used as cytoplasmic and nuclear markers, respectively. Optical density of the eEF2 bands phosphorylated/total in cytoplasm and nucleus were normalized to a control (α-tubulin or hnRNP). Values are the mean and SEM of 4 experiments. *p<0.05 and ** p<0.01 versus the cytoplasmic control value, †††p<0.001 versus the nuclear control value. ‡‡‡ p<0.001 versus the cytoplasmic control value.

