
Figure 5.
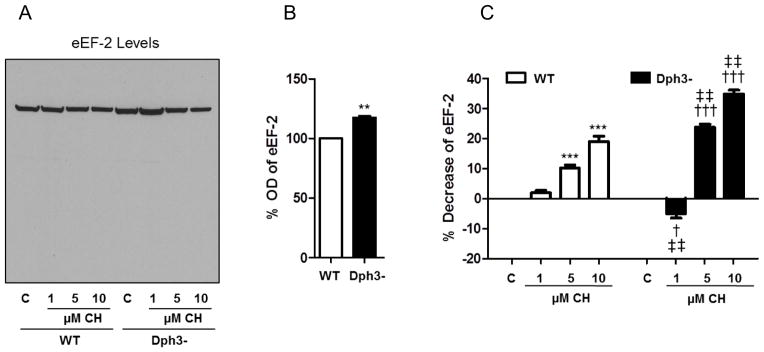
Levels of total eEF2 mirror the changes observed in the newly synthesized proteins assays. To directly determine the effects of CH on eEF2, wild-type cells (WT) and diphthamide-deficient cells (Dph3−) were pretreated with CH. A. Immunoblot analysis showing eEF-2 levels in the same nitrocellulose membrane depicted in Figure 4A-B. B. Optical density of the eEF-2 bands under basal conditions. Values are the mean and SEM of 4 experiments. *p< 0.05 and **p<0.01 vs. WT control. C. Optical density of the eEF2 bands following CH treatment. Values are the mean and SEM of 4 experiments. *p< 0.05 and ***p<0.001 versus the WT control value. †††p<0.001 versus the diphthamide-deficient cell control value. ‡‡ p<0.01 versus the WT control value. § p<0.05 versus the WT 1 μM CH value.