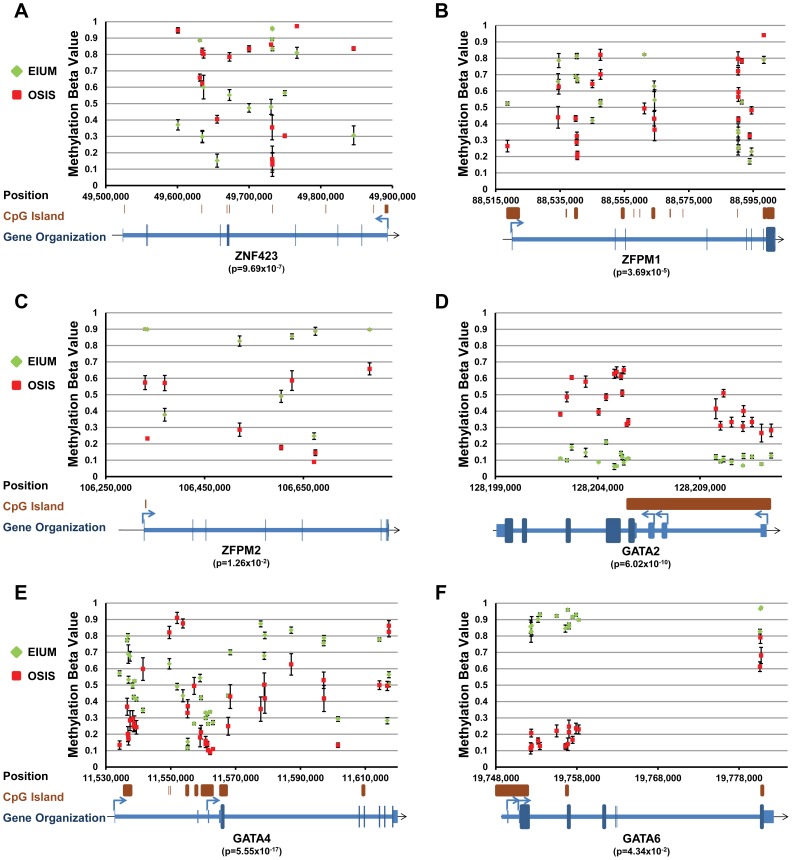
Figure 7. Key transcription factors with differential methylation (part 2).
Methylation maps for the following six genes show the differentially methylated CpGs identified by ANOVA interaction analysis: (A) ZNF423; (B)ZFPM1; (C) ZFPM2; (D) GATA2; (E) GATA4; (F) GATA6. Each plot shows the average β-value for untreated EIUM (green diamond) and OSIS (red squares) at the genomic coordinate for each identified CpG (error bars show SEM). CGI's and gene diagrams are illustrated below each plot. (When significant, the lowest p-value obtained from the ANOVA interaction is shown below gene symbols.)

