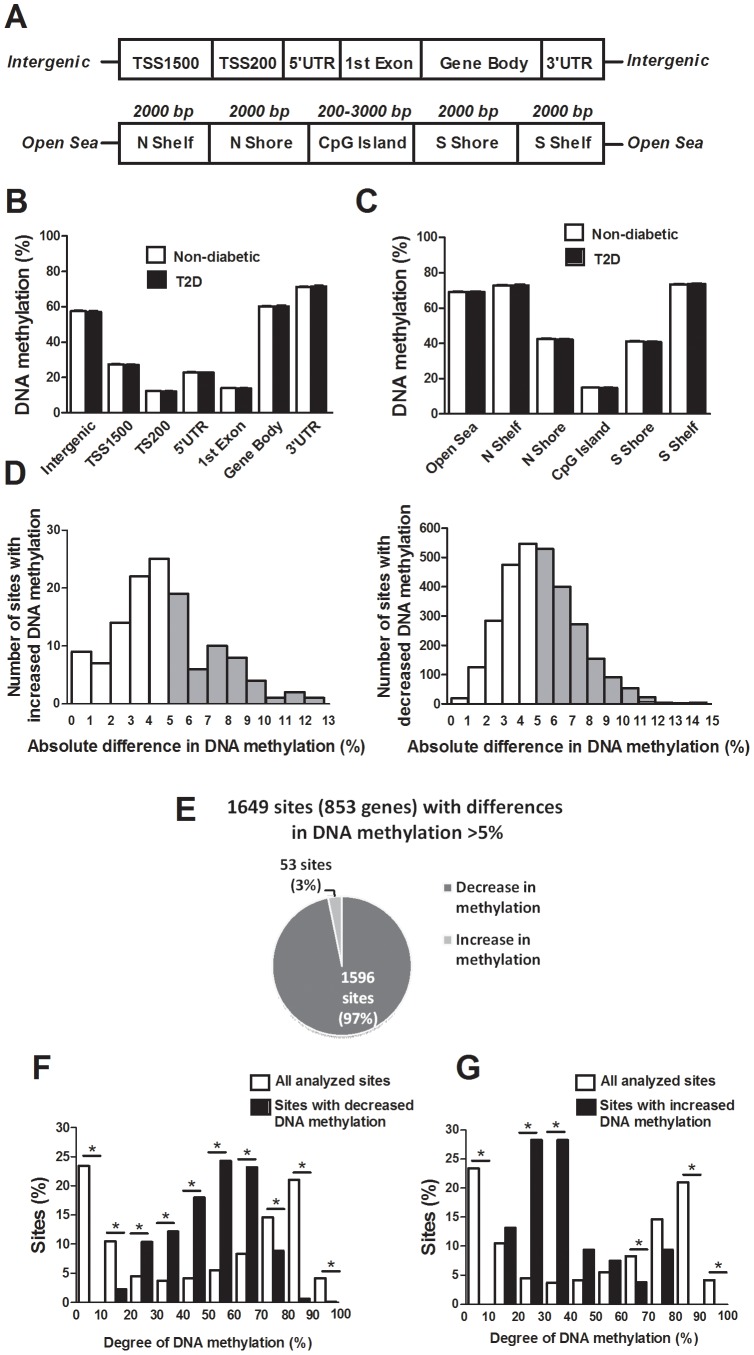
Figure 1. The human methylome in pancreatic islets from 15 T2D and 34 non-diabetic donors.
(A) All analyzed DNA methylation sites on the Infinium HumanMethylation450 BeadChip are mapped to gene regions based on their functional genome distribution and CpG island regions based on CpG content and neighbourhood context [68]. TSS: proximal promoter, defined as 200 bp or 1500 bp upstream of the transcription start site. UTR: untranslated region. CpG island: 200 bp (or more) stretch of DNA with a C+G content of >50% and an observed CpG/expected CpG in excess of 0.6. Shore: the flanking region of CpG islands, 0–2000 bp. Shelf: regions flanking island shores, i.e., covering 2000–4000 bp distant from the CpG island [68]. Global DNA methylation in human pancreatic islets of T2D and non-diabetic donors is shown for (B) each gene region and (C) CpG island regions. Global DNA methylation is calculated as average DNA methylation based on all CpG sites in each annotated region on the chip. (D) The absolute difference in DNA methylation of 3,116 individual sites, including 2,988 sites with decreased and 128 sites with increased DNA methylation in T2D compared with non-diabetic human islets with q<0.05 based on a FDR analysis. 1,649 sites with an absolute difference in DNA methylation ≥5% are represented by grey bars. (E) Pie chart describing the number of sites that exhibit increased or decreased DNA methylation in T2D compared with non-diabetic human islets with an absolute difference in methylation ≥5% and q<0.05. The degree of DNA methylation is shown for (F) the 1,596 CpG sites with decreased DNA methylation and (G) the 53 sites with increased DNA methylation in T2D vs. non-diabetic islets in comparison to the degree of methylation of all analyzed CpG sites in the human islets using the Infinium HumanMethylation450 BeadChip.

