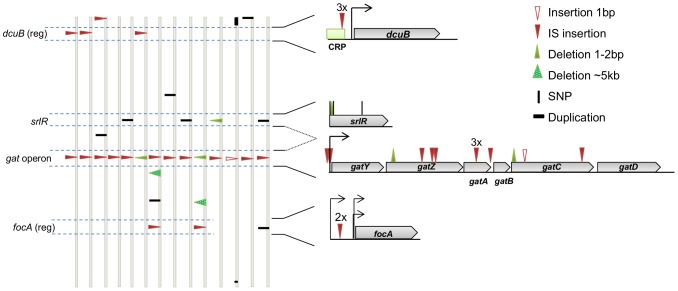
Figure 3. The genetic basis of adaptive mutations and the level of parallelism between populations.
Identified mutations in clones isolated from populations 1.1 to 1.14 (evolved in vivo for 24 days), represented along the E. coli chromosome. For simplicity, the genomes are represented linearly and vertically drawn. The type and position of mutations are shown by triangles for insertions and deletions, small vertical bars denote single nucleotide polymorphisms (SNPs), and one duplication in clone number 1.12 is depicted as a horizontal bar. See the symbol legend for other events. The genes dcuB, srlR and focA and one operon (gat) are highlighted. These represent regions of parallel mutation in at least two genomes. The genomic context of these mutations is represented on the right. (reg) after the gene name, means that the regulatory region, rather than the coding region, was affected. Numbers above marked mutations represent the number of times a particular mutation was detected at the same position.

