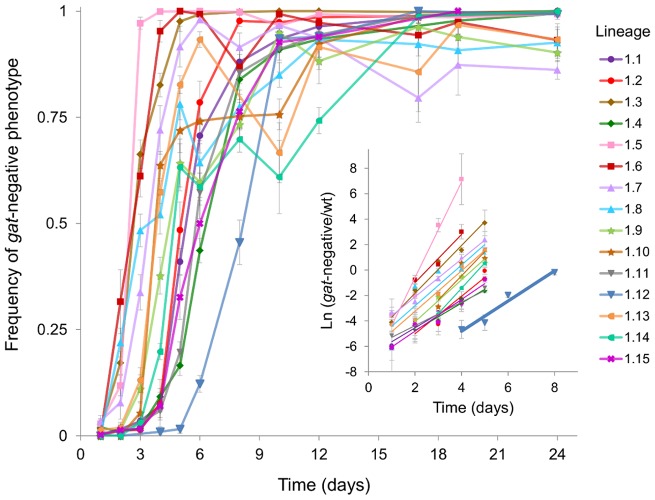
Figure 4. Emergence and spread of beneficial mutations in the gat operon.
Dynamics of frequency change of the gat-negative phenotype over time are shown for all populations (1.1 to 1.15). Inset: The natural logarithm of the ratio of gat-negative individuals to wild type over the first 5 days of adaptation is shown as dots. Each group of points was fitted to a linear regression (represented as lines). Highlighted in bold is the population 1.12 for which the slope corresponds to an estimate of the selection coefficient of 0.075±0.01 (per generation).

