Fig. 10.

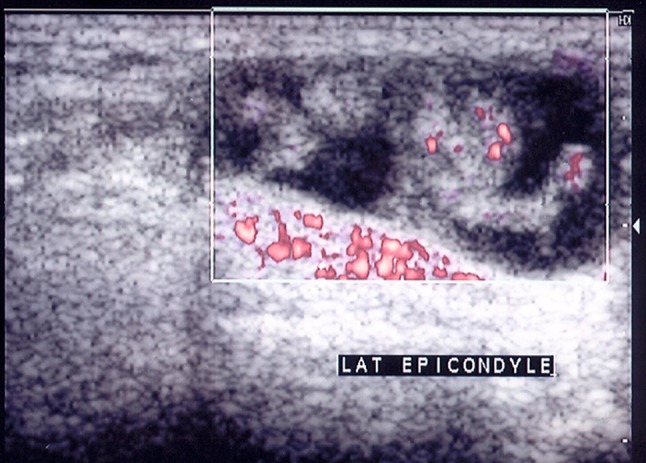
Power Doppler ultrasound image (5–12 mHz) of the olecranon fossa showing lobulated synovial thickening surrounded by hypoechoic fluid. The active Doppler signal confirms the presence of active inflammation

Power Doppler ultrasound image (5–12 mHz) of the olecranon fossa showing lobulated synovial thickening surrounded by hypoechoic fluid. The active Doppler signal confirms the presence of active inflammation