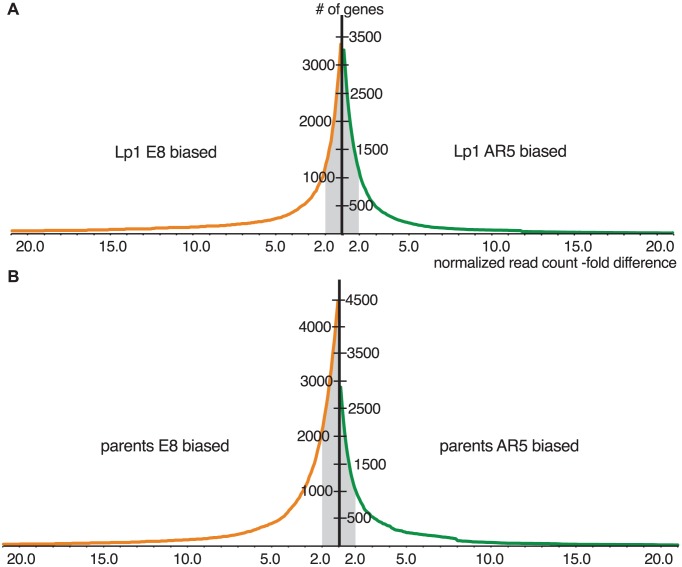
Figure 5. Cumulative distributions of gene expression ratios for Lp1 and parents.
Plotted are the cumulative distributions of genes by normalized gene expression ratio between homeologs in Lp1 (A), and between orthologs from the parents (B). Those with higher expression from the E8-derived copy are shown in orange (left); higher AR5-derived expression in green (right). Grey shading indicates the pool of genes with less than 2-fold expression difference between copies (not differentially expressed). The bias towards more orthologs in E8 having greater relative expression can be seen in (B).

