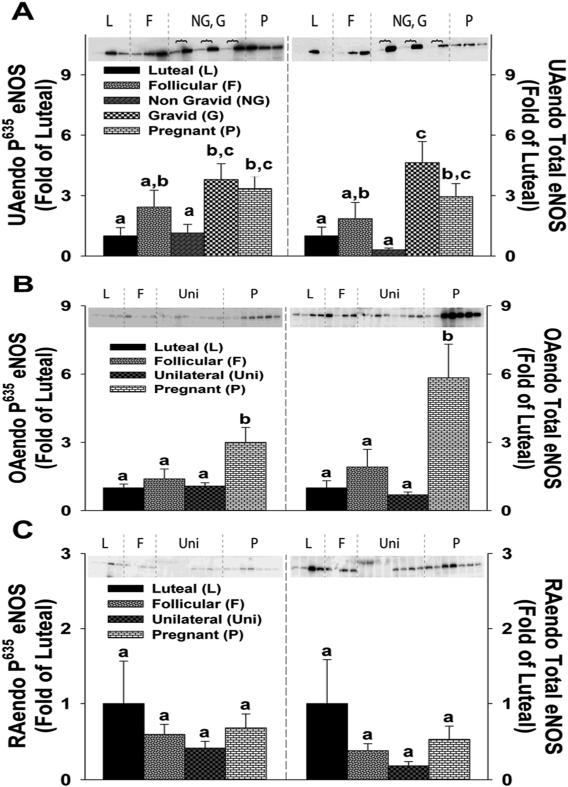
Figure 3. P635 eNOS and Total eNOS protein expression in (A)uterine artery (UAendo) and (B&C)systemic artery endothelium (OAendo/RAendo) from luteal, follicular, unilateral, and pregnant ewes.
Western Blot analysis comparing the relative levels of P635 eNOS and total eNOS in (A)UAendo and (B)OAendo and (C)RAendo obtained from luteal (L;n=8), follicular (F;n=8), unilateral [nongravid (NG) vs. gravid(G) n=15], and pregnant (P;n=23) sheep for UAendo as well as luteal (L;n=4), follicular (F;n=4), unilateral (Uni;n=8) and pregnant (P;n=7) for both OAendo and RAendo. Data are expressed as Means±SEM fold of L. Horizontal brackets  represent NG (left lanes), G(right lanes) pairs within individual animals. Different letters denote differences (P<0.05).

