
FIGURE 1. RESPONDERS BY TREATMENT GROUP.
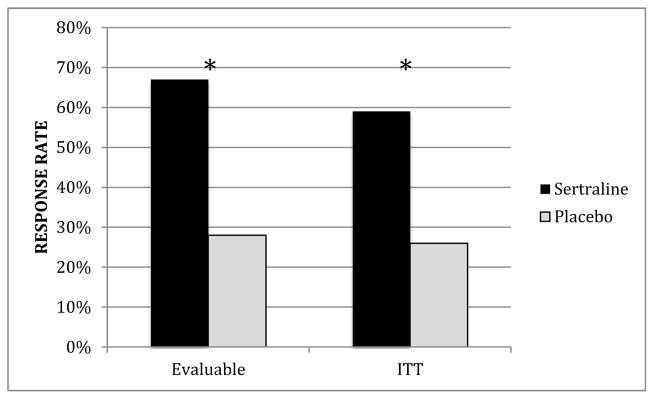
Response rates in intent to treat (ITT) and evaluable samples, by treatment group, represented as percentage. In the evaluable group, there was a significantly greater number of responders among those women randomized to sertraline (67%, 10/15) compared to those in the placebo group (28%, 5/18), (χ2 (1)=4.99, p=0.03). In the ITT group, there was a significantly greater number of responders among those women randomized to sertraline (59%, 10/17) vs. those randomized to placebo (26%, 5/19), (χ2 (1)=3.9, p=0.05).