
Figure 2.
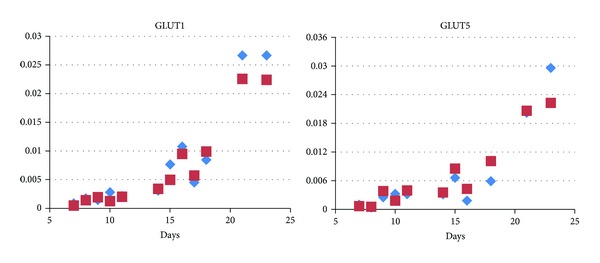
Expression of the glucose transporter GLUT1 and the fructose transporter GLUT5. Both transport proteins exhibit a steep rise during maturation. However, no difference is seen in the absence (blue diamonds) and in the presence (red squares) of fructose. y-axis: relative expression compared to expression of actin mRNA. Each symbol depicts one qPCR measurement per dish in a representative experiment.