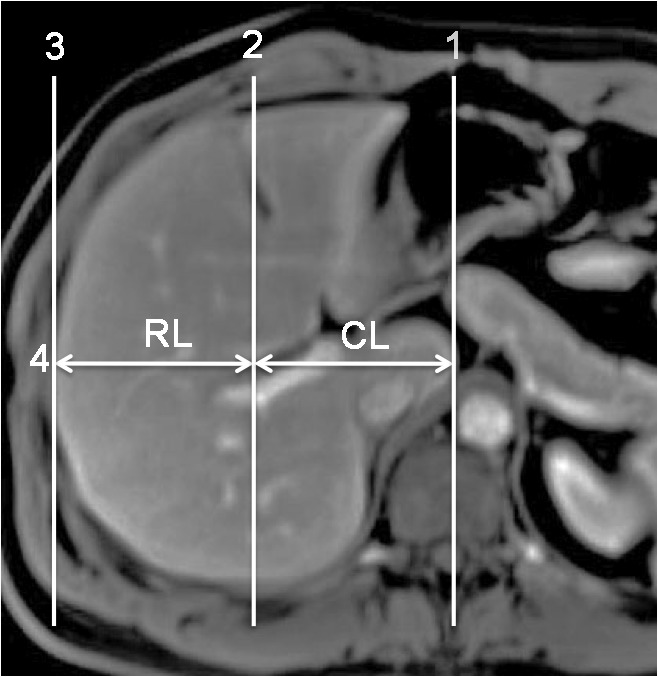
Fig.3.

Axial contrast-enhanced FFE MR image (5.1/1.69, 25° flip angle) obtained during the portovenous phase at the level of right portal vein bifurcation shows the method of calculating C/RL [9]. Line 1, line 2, and line 3 are parallel to the midsagittal plane. Line 1 is drawn through the medial margin of the caudate lobe. Line 2 is drawn through the right lateral wall of the bifurcation of the right portal vein and line 3 is drawn through the most lateral margin of the right lobe. The widths of the caudate and right lobe are calculated on line 4. Line 4 is perpendicular to line 1 and is situated at midway between the posterior wall of the main portal vein and the anterior wall of the inferior vena cava. CL – the width of the caudate lobe. RL – the width of the right lobe.
