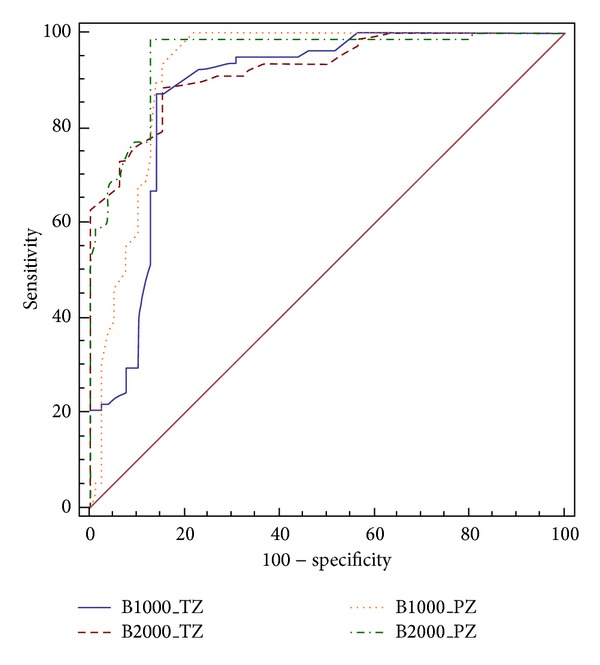
Figure 6.

ROC curves for prostate cancer detection in the PZ (yellow and green lines) and TZ (blue and red lines) using ADC maps at b-values of 0–1000 s/mm2 and 0–2000 s/mm2.

ROC curves for prostate cancer detection in the PZ (yellow and green lines) and TZ (blue and red lines) using ADC maps at b-values of 0–1000 s/mm2 and 0–2000 s/mm2.