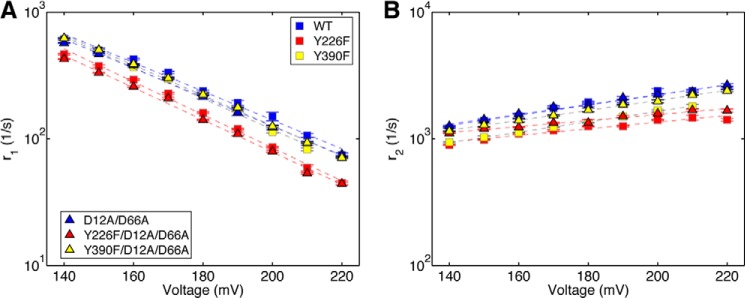
FIGURE 4.

Transition rates of the Φ29 DNAP translocation step extracted from ionic current traces measured in absence of dNTP. Shown are plots of log(r1) versus voltage (A) and log(r2) versus voltage (B) for binary complexes formed between the wild type (blue squares), Y226F (red squares), Y390F (yellow squares), D12A/D66A (blue triangles), Y226F/D12A/D66A (red triangles), or Y390F/D12A/D66A (yellow triangles) Φ29 DNAP and DNA1. Each plotted point shows the mean ± S.E. In the absence of dNTP, the fluctuation rates between the pre-translocation and post-translocation states are fully described by a two-state model with two transition rates (8). Each plotted data point shows the means ± S.E., determined from 15–30 ionic current time traces for individual captured complexes; each time trace had a duration of 5–10 s.
