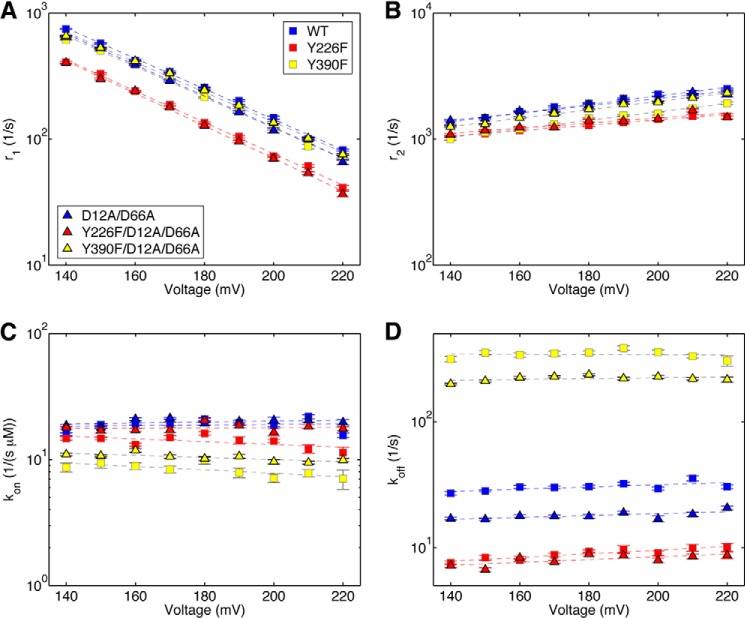
FIGURE 6.
Translocation rates and dNTP association and dissociation rates determined simultaneously from ionic current traces measured in the presence of dNTP. Shown are plots of log(r1) versus voltage (A) and log(r2) versus voltage (B) for complexes formed between the wild type, Y226F, Y390F, D12A/D66A, Y226F/D12A/D66A, and Y390F/D12A/D66A Φ29 DNAP and DNA1, captured in the presence of dGTP. Also shown are plots of kon versus voltage (C) and koff versus voltage (D) for complexes formed between the wild type, Y226F, Y390F, D12A/D66A, Y226F/D12A/D66A, and Y390F/D12A/D66A Φ29 DNAP and DNA1, captured in the presence of dGTP. Rates were extracted from ionic current traces using the autocorrelation function and the three-state model shown in Fig. 2E. Plot symbols for each of the enzymes are given in the legend to Fig. 4. Error bars, S.E. Each data point was determined from 15–30 ionic current time traces for individual captured complexes; each time trace had a duration of 5–10 s. The data plotted are for complexes captured in the presence of the following dGTP concentrations: wild type, 10 μm; D12A/D66A, 10 μm; Y226F, 5 μm; Y390F, 20 μm; Y226F/D12A/D66A, 5 μm; and Y390F/D12A/D66A, 20 μm. Although we have shown that all four transition rates (r1, r2, kon, and koff) are independent of [dNTP] (9), the method of extracting the rates from the ionic current traces using autocorrelation and the three-state model (Fig. 2E) is most robust when using data collected under conditions where all three states are well sampled. For example, when the dNTP concentration is very low, the dGTP-bound state is not well sampled; when the dNTP concentration is very high, only the dGTP-bound state is well sampled. The dNTP concentrations optimal for the analysis vary with the dNTP binding affinity of each mutant.

