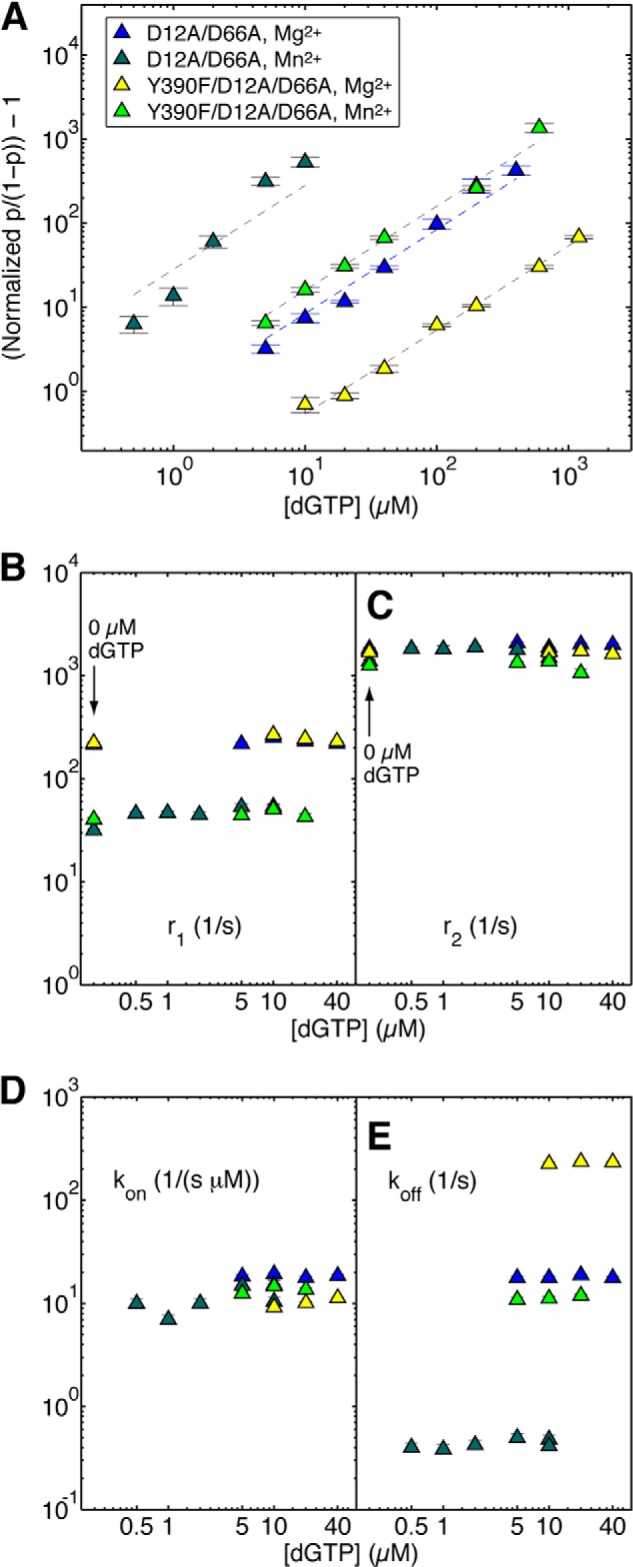
FIGURE 7.

Effects of Mn2+ on dNTP binding to mutant Φ29 DNAP-DNA complexes. A, the (normalized p/(1 − p)) − 1 is plotted on a log scale as a function of dGTP concentration for complexes formed between DNA1 and the D12A/D66A mutant in the presence of Mg2+ (blue triangles) or Mn2+ (dark green triangles) and between DNA1 and the Y390F/D12A/D66A mutant in the presence of Mg2+ (yellow triangles) or Mn2+ (light green triangles). Complexes were captured at 180 mV. The data are plotted according to the concentration of dGTP added to the nanopore cis chamber. Because a fraction of the added dGTP is bound by complexes in the bulk phase (∼100-μl cis chamber volume, in which [DNA1] = 1 μm, and [enzyme] = 0.75 μm), the free [dGTP] is lower than the input [dGTP]. The difference is significant when the input [dGTP] is comparable with or lower than the concentration of complexes. This accounts for the difference between the data for D12A/D66A mutant in the presence of Mn2+ (A, dark green triangles) and the linear fitting because the linear relation is with respect to the free [dGTP]. Shown are plots of r1 versus [dGTP] (B) and r2 versus [dGTP] (C) for complexes formed between the D12A/D66A mutant or the Y390F/D12A/D66A mutant and DNA1, captured at 180 mV in the presence of Mg2+ or Mn2+. Because there is no zero value on the log scale plot, in B and C, the values of r1 and r2 for binary complexes of the two mutants, captured in the presence of Mg2+ or Mn2+ are placed on the plot at the position for 0.2 μm dGTP and are indicated by an arrow and label (0 μm dGTP). The binary complex translocation rates were determined using autocorrelation and the two-state model (8); the translocation rates in the presence of dGTP were determined using autocorrelation and the three-state model (Fig. 2E) (9). Shown are plots of kon versus [dGTP] (D) and koff versus [dGTP] (E) for complexes formed between the D12A/D66A mutant or the Y390F/D12A/D66A mutant and DNA1, captured at 180 mV in the presence of Mg2+ or Mn2+. The dNTP binding rates were determined using autocorrelation and the three-state model. Plot symbols in B–D are the same as in A. Each data point was determined from 15–30 ionic current time traces for individual captured complexes; each time trace had a duration of 5–10 s. Error bars, S.E.
