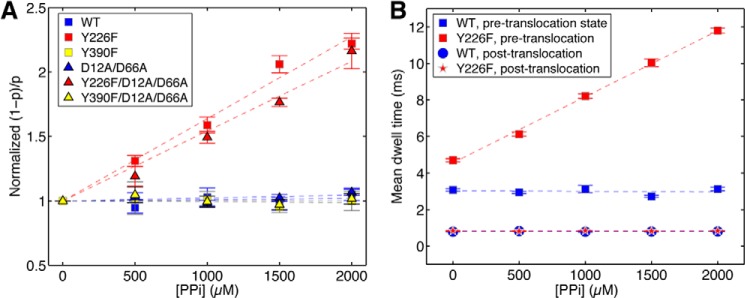
FIGURE 8.

Pyrophosphate binding to mutant Φ29 DNAP-DNA complexes. A, the normalized (1 − p)/p (where (1 − p) is the probability of pre-translocation state occupancy, and the normalized (1 − p)/p is the value of (1 − p)/p in the presence of a given concentration of pyrophosphate, divided by the value for (1 − p)/p for the same Φ29 DNAP-DNA complex at 0 mm pyrophosphate) is plotted as a function of pyrophosphate concentration for complexes formed between wild type, Y226F, Y390F, D12A/D66A, Y226F/D12A/D66A, or Y390F/D12A/D66A Φ29 DNAP and DNA1. Plot symbols for each of the enzymes are given in the legend to Fig. 4. In B, the mean dwell times in the pre-translocation and post-translocation states for complexes formed between wild type Φ29 DNAP (blue squares, pre-translocation; blue circles, post-translocation) and the Y226F mutant (red squares, pre-translocation; red stars, post-translocation) are plotted as a function of pyrophosphate concentration. Complexes were captured at 160 mV. Each data point was determined from 15–30 ionic current time traces for individual captured complexes; each time trace had a duration of 5–10 s. Error bars, S.E.
