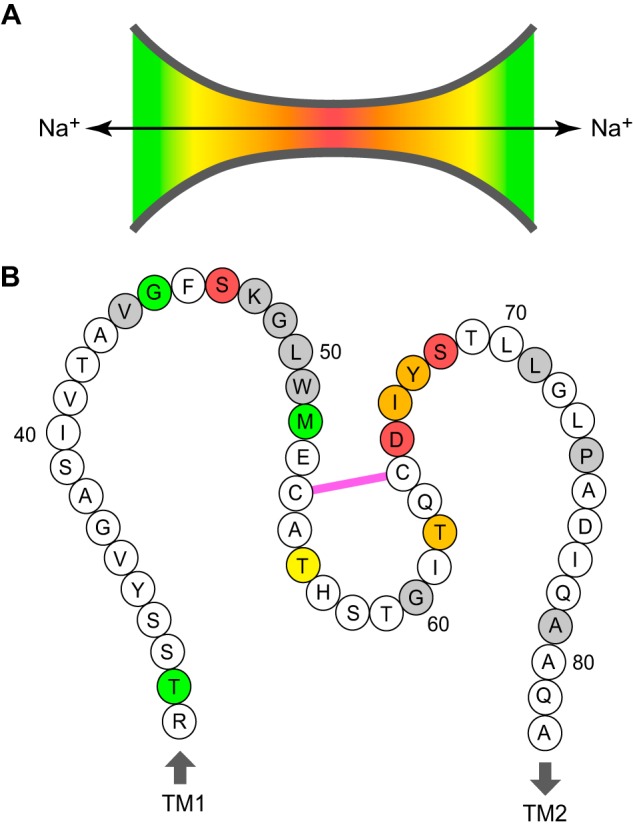
FIGURE 9.

Location of predicted pore-lining residues in the claudin-2 pore. A, funnel model of the claudin pore. The heat map indicates the relative position within the pore (red at the narrowest region and green near the opening). B, cartoon of the claudin-2 ECL1 showing all 52 residues from Arg31 to Ala82, anchored by the first and second transmembrane helices (TM1 and TM2). Pore-lining residues are color-coded according to their predicted position in the model in A. Residues that when mutated to cysteine resulted in loss of expression or function are shaded gray. Cys54 and Cys64 are shown to be connected by a disulfide bond (pink).
