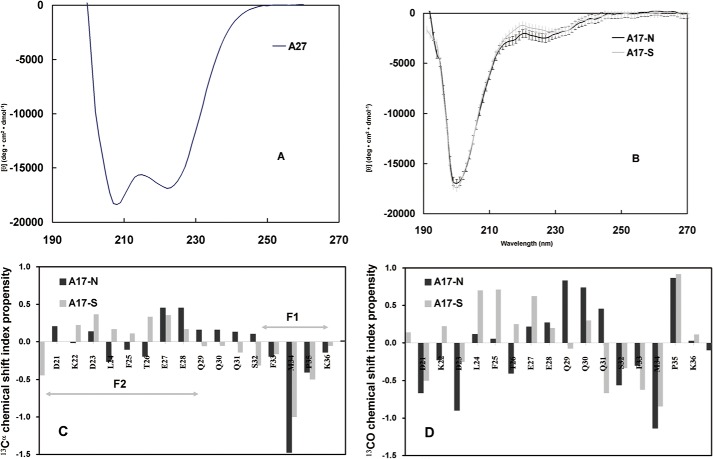
FIGURE 4.
Secondary structure of A17 fragments based on CD and CSI analyses. Far-UV CD spectra of A27 (A), A17-N (dark line) and A17-S (gray line) (B). The A17-N spectrum indicated a superimposition of the major random coil and minor α-helix patterns, where the former exhibited ellipticity at 200 nm, and the latter exhibited ellipticity at 208 and 222 nm. Furthermore, the A17-S spectrum revealed a similar spectral pattern with the exception of a slightly lower value at ∼220 nm. In contrast to C, the A27 spectrum indicated a structural pattern distinct from that of a typical α-helix. 13Cα (C) and 13CO (D) chemical shift propensity index analysis of the A27 binding domain of A17-N and A17-S. The chemical shift index was determined as (δ − δrandom)/(δα − δrandom), where δ is the experimental chemical shift and δα and δrandom are the chemical shift values reported in the literature for a α-structure and random coil, respectively. The propensity index for the EEQQQ segment of A17-N is >0.3, suggesting a mild α-helical conformation. However, in the CSI analysis of A17-S, no such conformation is observed. The sequence numbering for A17 (single-letter code) is shown on the horizontal axis. C, respective F1- and F2-binding sites are indicated by an arrow bar.

