FIGURE 3.
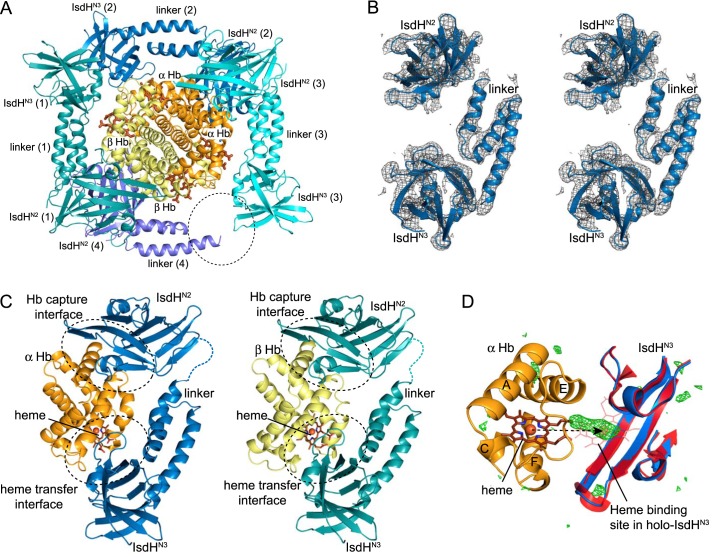
Crystal structure of IsdHN2-N3 bound to Hb. A, four IsdHN2-N3 receptors bind to one Hb tetramer in the asymmetric unit of the crystal (PDB 4IJ2). Three of the IsdHN2-N3 receptors are complete, comprising IsdHN2, linker, and IsdHN3 domains. The position of the IsdHN3 domain in the fourth receptor molecule is not well defined (the expected location is marked by a dashed ellipse). B, stereo diagram showing the 2Fo − Fc electron density map for one full IsdHN2-N3 receptor contoured at 1 σ. C, detail of the IsdHN2-N3·α (blue/orange) and IsdHN2-N3·β (teal/yellow) interaction complexes. Residues from the loop regions, which are not modeled in the structure, are shown with dashed lines. D, the IsdHN3·α interface with Fo − Fc difference map shown at 3 σ (green), indicating electron density that is not accounted for by atoms of the IsdHN2-N3·Hb model. The structure of heme-bound IsdHN3 (PDB 2Z6F, red) is superimposed to indicate the expected binding position of the heme group (lines), which coincides with a peak of Fo − Fc difference electron density in the IsdHN2-N3·Hb complex (green). Heme transfer from globin to the IsdH receptor requires a relatively small translation of only 12 Å between the E and F helices of the globin (dashed arrow).

