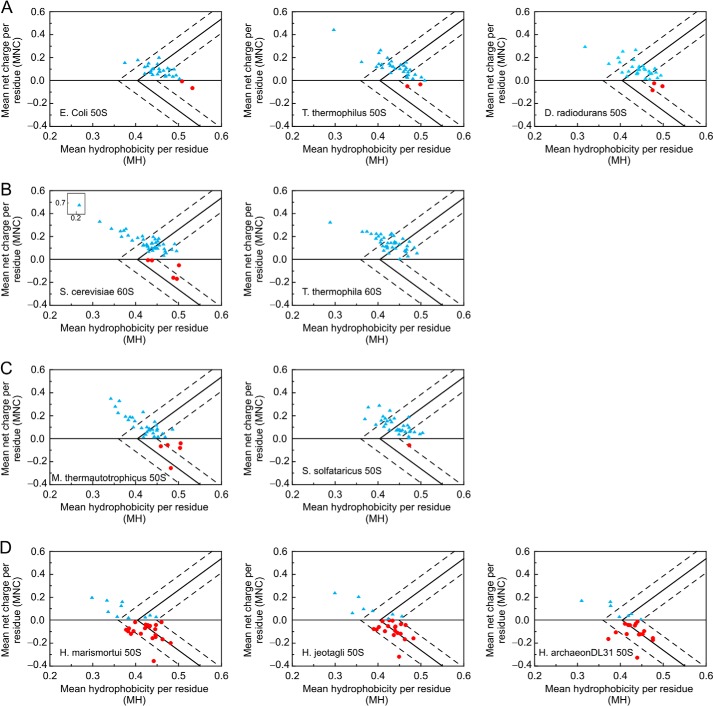
FIGURE 2.
Plots illustrating the MNC versus MH of proteins from the large ribosomal subunits of different organisms. Data are shown for bacteria (A), Eukaryota (B), non-halophilic archaea (C), and halophilic archaea (D). Light blue triangles and red circles denote proteins with positive and negative MNC, respectively. The solid line separates IDPs (on the left) from independently folded proteins (on the right). The regions on the left, right, and in between the dashed lines host IDPs, folded, and partially ordered proteins, respectively. Calculations were performed based on the UniProt Knowledgebase sequence information (see “Experimental Procedures”). H. archaeon, halophilic archaeon.

