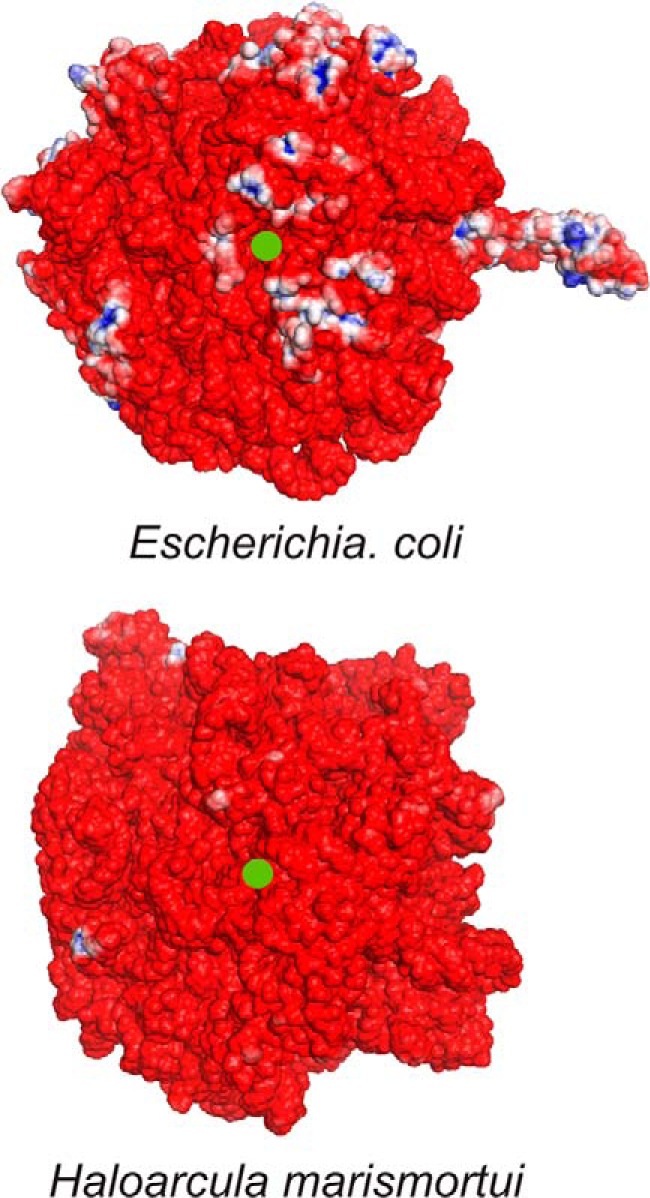
FIGURE 3.

Electrostatic surface potential maps of the 50 S subunit of ribosomes from E. coli and H. marismortui in proximity to the exit tunnel. The ribosomal exit tunnel is denoted by a green dot. Electrostatic potentials were obtained with APBS (150 mm ionic strength, solute dielectric of 2.0, and solvent dielectric of 78.0) using three-dimensional structures with Protein Data Bank codes 2AW4 (56) and 2QA4 (57) for E. coli and H. marismortui, respectively. Regions with positive (>+3 kBT/e) and negative potential (<−3 kBT/e) are shown in blue and red, respectively. kBT denotes an energy unit of 4.11 × 10⁻²¹ J at room temperature (where kB is the Boltzmann constant and T is temperature), and e denotes the electric charge in coulombs.
