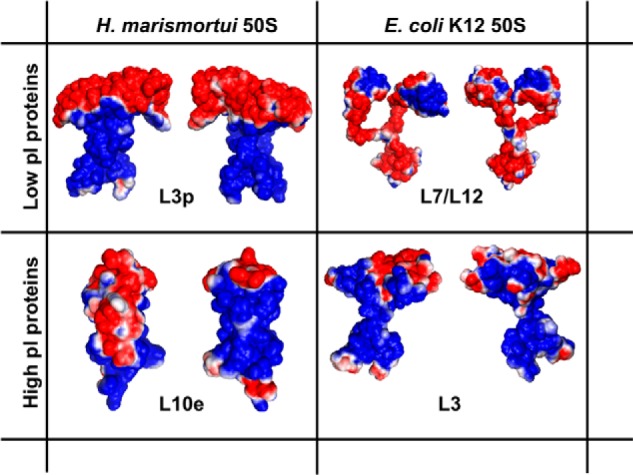
FIGURE 6.

Electrostatic surface potential map of four representative 50 S ribosomal proteins. Front and back views are shown for L3p and L10e from H. marismortui and L7/L12 and L3 from E. coli. Protein Data Bank code information is as follows: L3p, chain B of 2QA4 (57); L7/L12, 1RQU (58); L10e, chain H of 2QA4; L3, chain D of 2AW4 (56).
