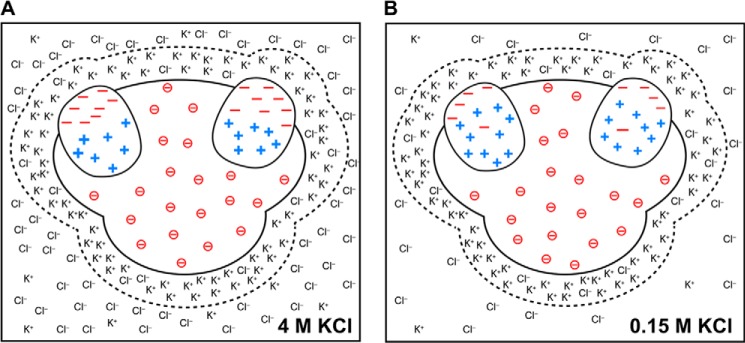
FIGURE 7.

Schematic model illustrating the proposed charge distribution in ribosomes from halophilic and non-halophilic organisms. A, ribosome from a halophile in 4 m KCl. B, ribosome from a non-halophile in 150 mm KCl. The dashed lines around the ribosomal surfaces enclose a simplified view of counterion layers and emphasize the postulated similarity of these layers in halophilic and non-halophilic organisms. For simplicity, only two ribosomal proteins are shown embedded in each ribosome.
