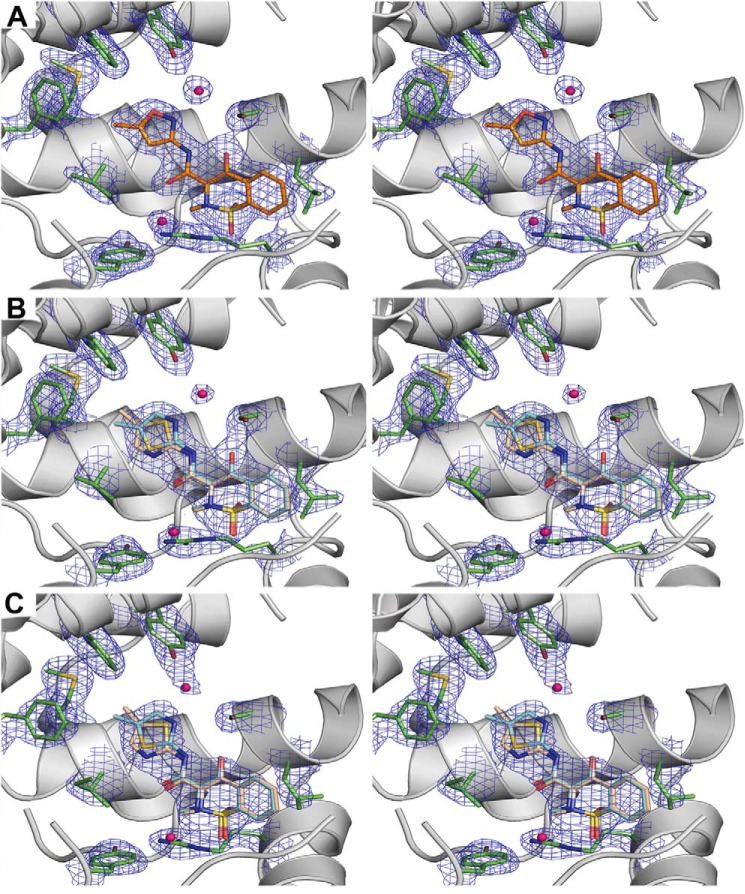
FIGURE 2.
Stereo-diagram of the electron density maps around isoxicam and meloxicam. A, a simulated annealing composite omit map in the active site of mCOX-2·isoxicam complex. B, a simulated annealing composite omit map in the active site of mCOX-2·meloxicam complex. C, a simulated annealing composite omit map in the active site of oCOX-1·meloxicam complex. The simulated annealing omit maps (34) are contoured at 1.5 σ in blue mesh; the key residues are illustrated with a stick representation of the final model (carbon in green, oxygen in red, isoxicam in orange); the molecule of isoxicam is colored in orange, and meloxicam is colored in wheat and yellow.

