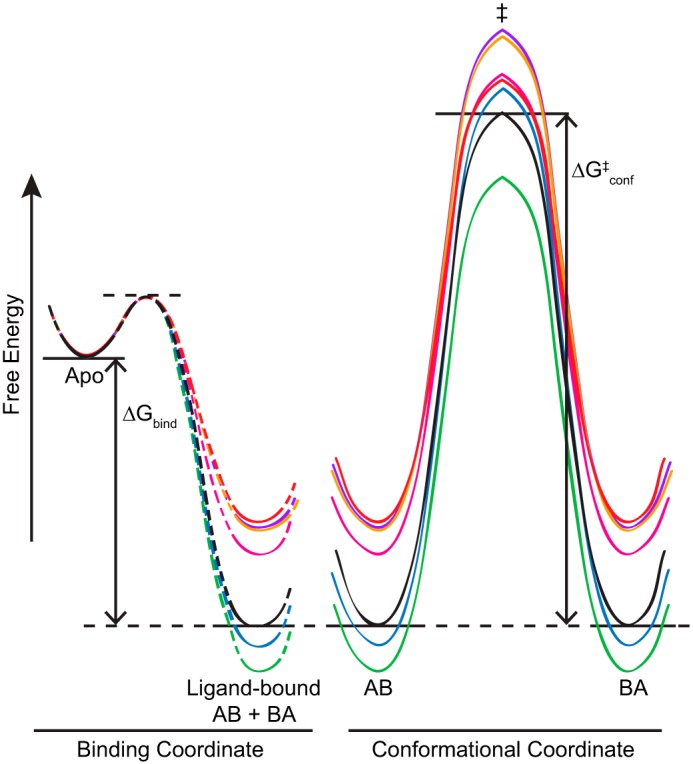
FIGURE 6.

A simplified energy diagram illustrates the connection between ligand binding (left) and conformational exchange between the open-in (AB) and open-out (BA) states of ligand-bound EmrE (right). The free energy of binding, ΔGbind, was calculated from measured binding affinities. The dashed lines indicate that nothing is known about the transition state connecting the apo and bound states of EmrE. The two ligand-bound ground states (AB and BA) have equal energy and are separated by the transition state, ‡, with energetic barrier of height ΔGconf‡ calculated from the rates of conformational interconversion and transition-state theory. The diagram shows the tetrahedral series, MeTPP+ (red), EtTPP+ (magenta), TPP+ (black), MBTPP+ (green), and DPhTPP+ (blue), as well as the planar substrates DQ2+ (purple) and PP2+ (orange).
