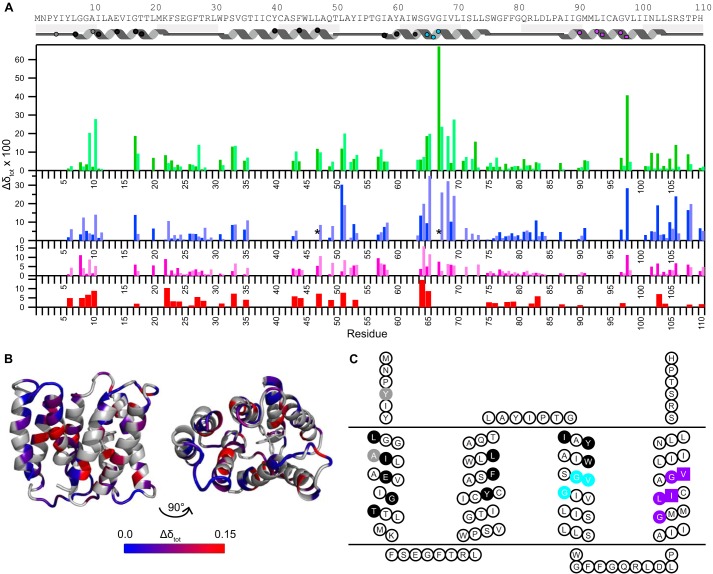
FIGURE 7.
Chemical shift differences highlight important functional residues. A, chemical shift changes between TPP+-bound EmrE and EmrE bound to other TPP+ derivatives (MeTPP+, red; EtTPP+, magenta; DPhTPP+, blue; MBTPP+, green), as described under “Experimental Procedures.” States A and B are distinguished via the dark and light shades, respectively. Due to a lack in connectivity, state A versus B is not certain for residues 17, 31, 67, 98, and 108. The asterisk (*) indicates that the peak moves significantly, but the exact assignment is uncertain. Residues with no data indicate a lack of transferred assignment. The approximate secondary structure according to the crystal structure (35) is shown at the top and includes symbols to allow easy comparison with C. B, chemical shift differences between MBTPP+- and TPP+-bound EmrE, plotted onto the TPP+-bound structure (Protein Data Bank code 3B5D, PyMOL) reveal regions sensitive to ligand identity. Residues in gray indicate a lack of data. C, EmrE topology diagram highlighting specific functional regions of EmrE based on previously published mutagenesis studies: direct substrate binding and substrate specificity (black), TPP+/H+ coupling (gray), GVG helix kink motif (cyan), and GG7 dimerization motif (purple, squares represent the pivot point) (4, 5, 25, 35, 37–39). Fig. made using TOPO2.

