
FIGURE 2.
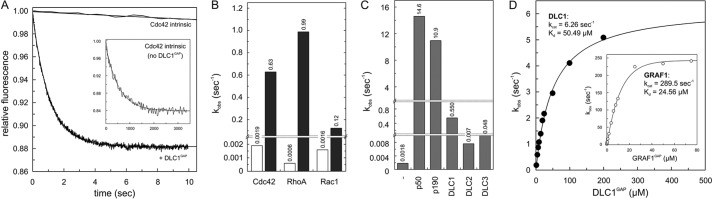
Inefficient GAP activities of the DLC isoforms. A, Cdc42-tamraGTP (0.2 μm) was rapidly mixed with 5 μm DLC1GAP to monitor the GAP-stimulated tamraGTP hydrolysis reaction of Cdc42 in real time. Note the very slow intrinsic GTPase reaction of Cdc42 (inset) that was measured in the absence of GAP. Rate constants (kobs) were obtained by single exponential fitting of the data. B, the kobs values of GTP hydrolysis of Rho proteins (0.2 μm) measured in the presence of DLC1GAP (5 μm) are represented as a column chart. Calculated -fold activation values were obtained by dividing the kobs values of GAP-stimulated reactions by the kobs values of the intrinsic reactions of respective GTPases. For convenience, the kobs values are given above the bar charts. C, measured GAP activities of DLC1, DLC2, and DLC3 (5 μm, respectively) toward Cdc42 (0.2 μm) were very low as compared with p150 and p190. D, the GTP hydrolysis of Cdc42 (0.2 μm) was measured in the presence of increasing concentrations of the respective GAP domains of DLC1 and GRAF1 (inset). The dependence of the kobs values of the GAP-stimulated GTP hydrolysis plotted on the concentrations of DLC1GAP and GRAF1 was fitted by a hyperbolic curve to obtain the kinetic parameters (kcat and Kd).