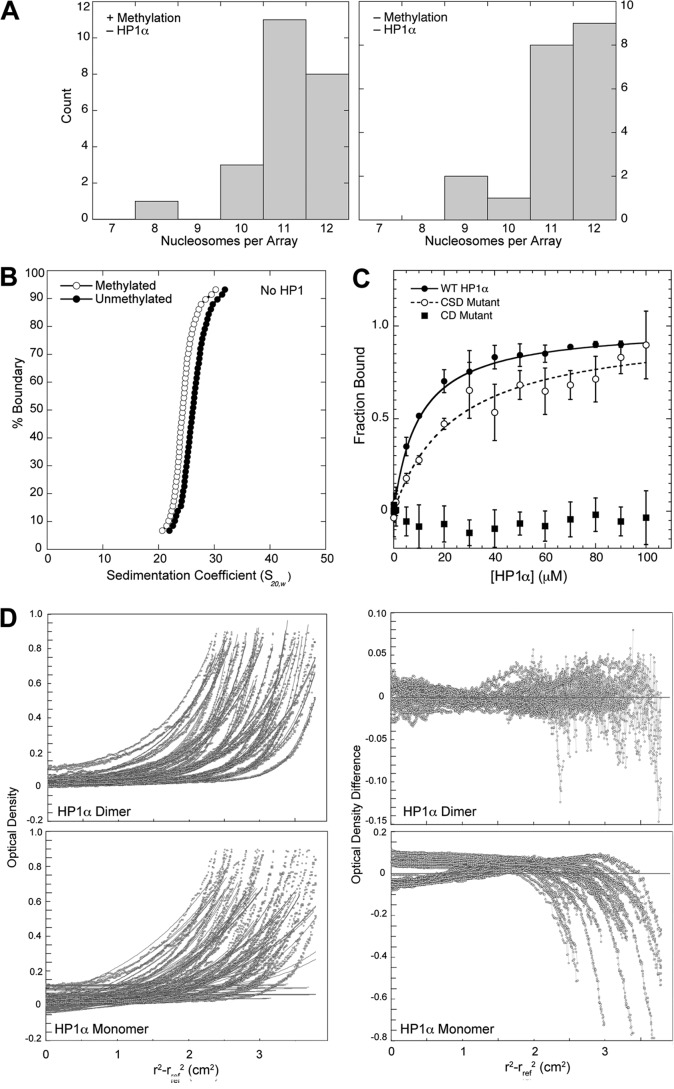
FIGURE 1.
Characterization of 601-177-12 nucleosomal arrays and recombinant HP1Hsα. A, distribution of nucleosomes per array for histone H3K9Me3-containing and unmethylated arrays at 8 mm NaCl. Numbers of nucleosomes/per array were made from electron micrographs similar to those shown in Fig. 4, A and B. B, integrated sedimentation coefficient distribution of arrays possessing histone H3K9Me3 and unmethylated H3. Midpoint S values for the methylated and unmethylated arrays are 24.8S and 26.0S, respectively. Sedimentation values were calculated using the enhanced van Holde-Weischet method and normalized to standard conditions of pure water at 20 °C. C, HP1Hsα binding to a histone H3K9me3 peptide was determined by fluorescence anisotropy for wild type, CD mutant, and CSD mutant proteins. KD values for the wild type, CSD mutant, and CD mutant were 9 ± 2 μm, 24 ± 1 μm, and >500 μm, respectively. S.D. for each data point is shown. D, characterization of HP1Hsα dimerization by equilibrium analytical ultracentrifugation. Wild type and mutant forms of HP1Hsα were analyzed at nine different concentrations in triplicate. Shown are the fits and residuals for wild type HP1Hsα, where the fits are forced to conform to either a dimeric species (top panels) or a monomeric species (bottom panels). Fits to the data are shown on the left; fit residuals are shown on the right. The expected molecular weight for the HP1Hsα monomers is 25.4 kDa, and the best-fit molecular weight values of wild type, CD mutant, and CSD mutant HP1Hsα proteins were 48.6, 45.2, and 22.6 KDa, respectively.

