FIGURE 6.
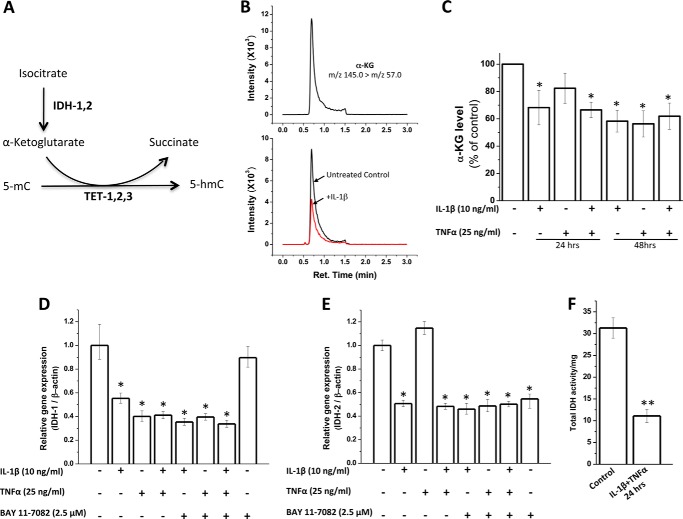
Regulation of activity and gene expression of IDHs and α-KG levels by IL-1β and TNF-α. A, schematic of conversion of 5-hmC from 5-mC by TET enzymes that use α-KG as a cofactor. B, representative LC-MS/MS MRM chromatograms of 0.01 ng/ml standard α-KG (upper panel) and culture supernatants of chondrocytes untreated (black line) and treated with 10 ng/ml IL-1β for 48 h (red line) (lower panel). C, α-KG levels in culture supernatants of human chondrocytes with or without treatment with cytokines for 24/48 h as measured by LC-MS/MS analysis. Results are expressed as percentage of untreated control. D and E, total RNA was isolated using the RNeasy kit and quantitated by spectrophotometry (A260) using NanoDrop. cDNA synthesis was performed using a QuantiTect reverse-transcription kit. mRNA levels of IDH1 (D) and IDH2 (E) were quantitated by real-time PCR using TaqMan assay. Data are presented as relative gene expression compared with β-actin (mean ± S.D. (error bars)). F, total IDH (NAD+- and NADP+-dependent) activity was measured by IDH assay kit. Data are expressed as total IDH activity/mg of cellular lysate protein (*, p < 0.05; **, p < 0.01).

