
FIGURE 4.
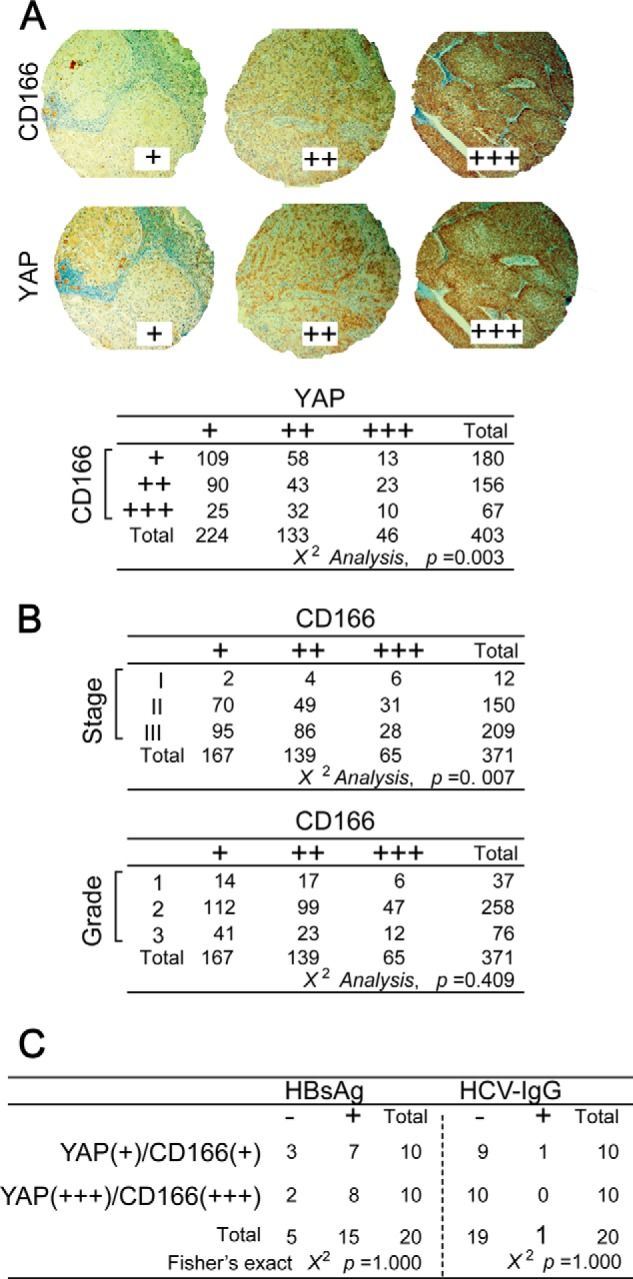
The expression pattern of CD166 and YAP as well as related clinical features in liver cancer samples. A, representative IHC images of CD166 and YAP staining from the TMA analysis (top). Statistical analysis of the TMA data using the χ2 test is shown at the bottom. B, tumor stage but not histologic grade was correlated with CD166 expression in liver cancer samples as analyzed by the χ2 test. C, no correlation between CD166-dependent YAP activation and hepatitis B virus or HCV infection as analyzed by Fisher's exact χ2 test. Serum HBsAg and HCV IgG were tested from the same patients whose liver cancer tissues were used for IHC determination for CD166 and YAP.