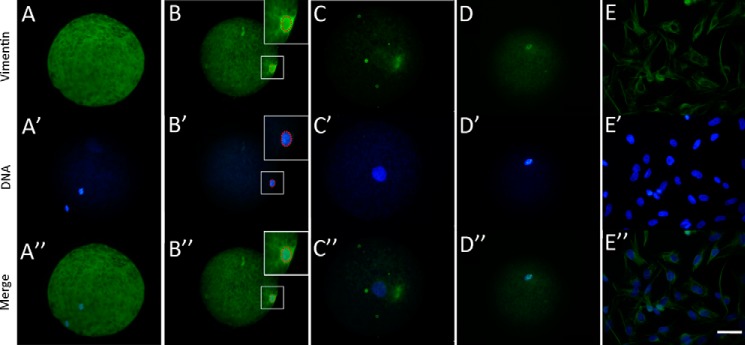
FIGURE 3.

Location of VIM in cloned embryos by immunofluorescence analysis. A, A′, and A″, immunofluorescence analysis of oocyte VIM. B, B′, and B″, location of VIM in cloned embryos at 2 h post-NT. C, C′, and C″, location of VIM in cloned embryos at 6 h post-NT. D, D′, and D″, location of injected VIM in cloned embryos at 2 h post-NT. E, E′, and E″, expression pattern of VIM in porcine fibroblasts. Green, VIM; blue, DNA. Scale bar, 50 μm.
