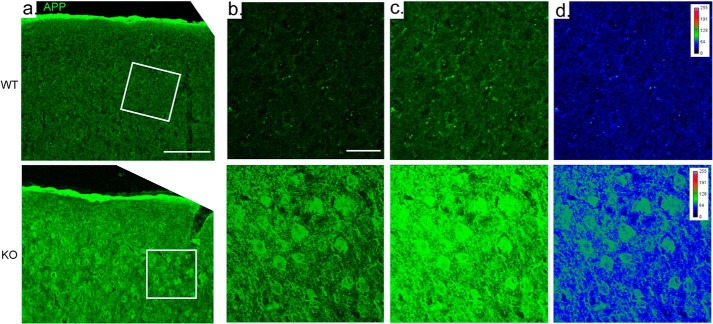
FIGURE 5.
Increased levels of APP in Fbxo2−/− brain. APP immunoreactivity is increased in the cortex of Fbxo2 null mice. a, confocal microscopy shows increased levels of APP in Fbxo2−/− mice (column a, lower row) compared with wild-type mice (upper row). From left to right, results from cortices are shown at 10× (a) and then in the denoted inset at 60× with a 2× optical zoom, at relatively lower (b) and higher brightness (c). d, a heat map at the far right illustrates differences in pixel intensity. Scale bar, 50 μm (a) and 20 μm (b).

