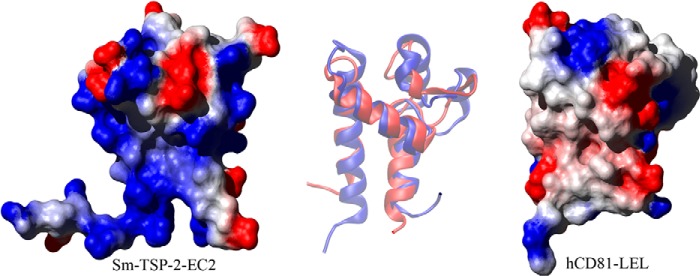
FIGURE 3.

Comparison of Sm-TSP-2-EC2 and hCD81-LEL. A comparison of the structures of Sm-TSP-2-EC2 and hCD81-LEL showing the surface electrostatic potential of the two molecules (produced using MOLMOL; Ref. 51). Both proteins are orientated so that the stem region and helices A and C of the Sm-TSP-2-EC2 structure are in the background with helix B bridging the two stem helices. The variable region is protruding to the top right of both molecules. In hCD81-LEL the constant domain exhibits a low polarity surface, and this area has been proposed as the interaction interface between homodimers of the molecule. This region in Sm-TSP-2-EC2 contrasts strongly with hCD81-LEL, showing a strongly positive electrostatic potential caused by the presence of multiple Lys residues in helix A of the EC2 domain. At center is an overlay of a schematic depiction of each molecule orientated in the same way as the surface diagrams. The overlay shows Sm-TSP-2-EC2 in red and hCD81-LEL in blue and highlights the contrast between the structural conservation in the stem region of the two TSPs and the diversity shown in the head region.
