
FIGURE 5.
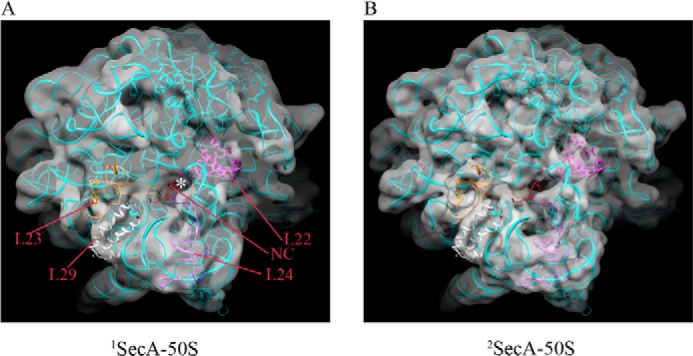
Fitting of the TnaC-stalled 50S model (PDB code 2WWQ) in 1SecA (A) and 2SecA density maps (B). Ribosomal proteins L22, L23, L24, and L29 present at the exit site tunnel are colored in magenta, gray, purple, and gold/yellow, respectively. A ribbon model of the TnaC nascent chain in the tunnel is shown in red. The tunnel exit is marked with a white asterisk.