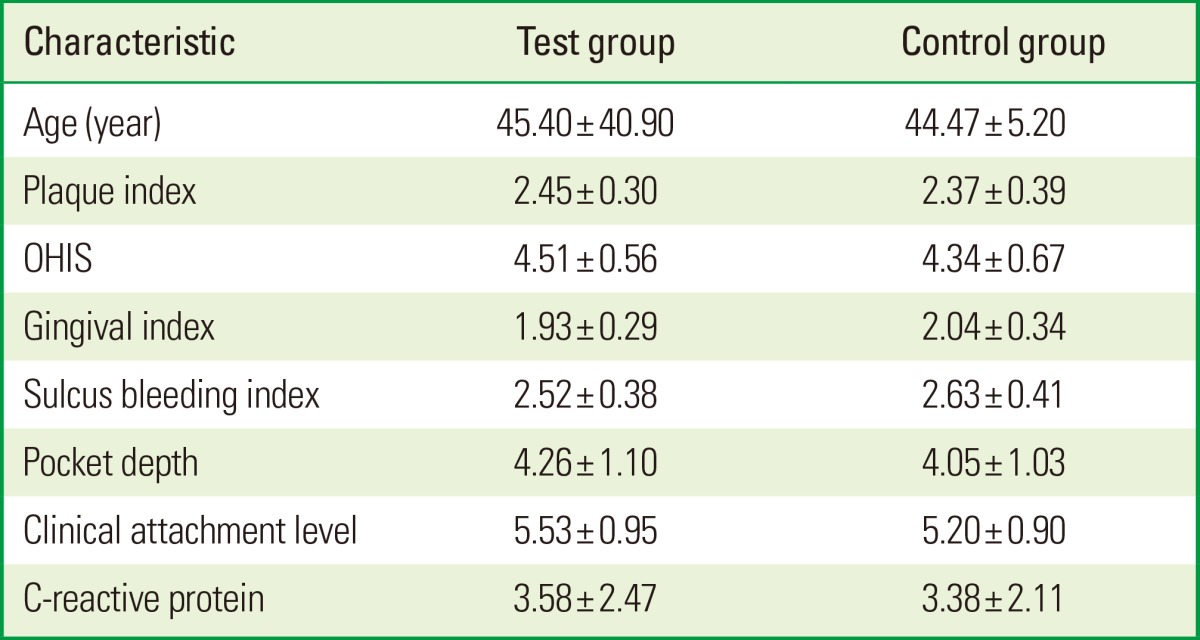
Table 1.
Demographics of subject population and baseline periodontal parameters

Values are presented as mean±standard deviation. Student t-test.
OHIS: oral hygiene index-simplified.
There were no significant differences between groups (P>0.05).
Demographics of subject population and baseline periodontal parameters

Values are presented as mean±standard deviation. Student t-test.
OHIS: oral hygiene index-simplified.
There were no significant differences between groups (P>0.05).