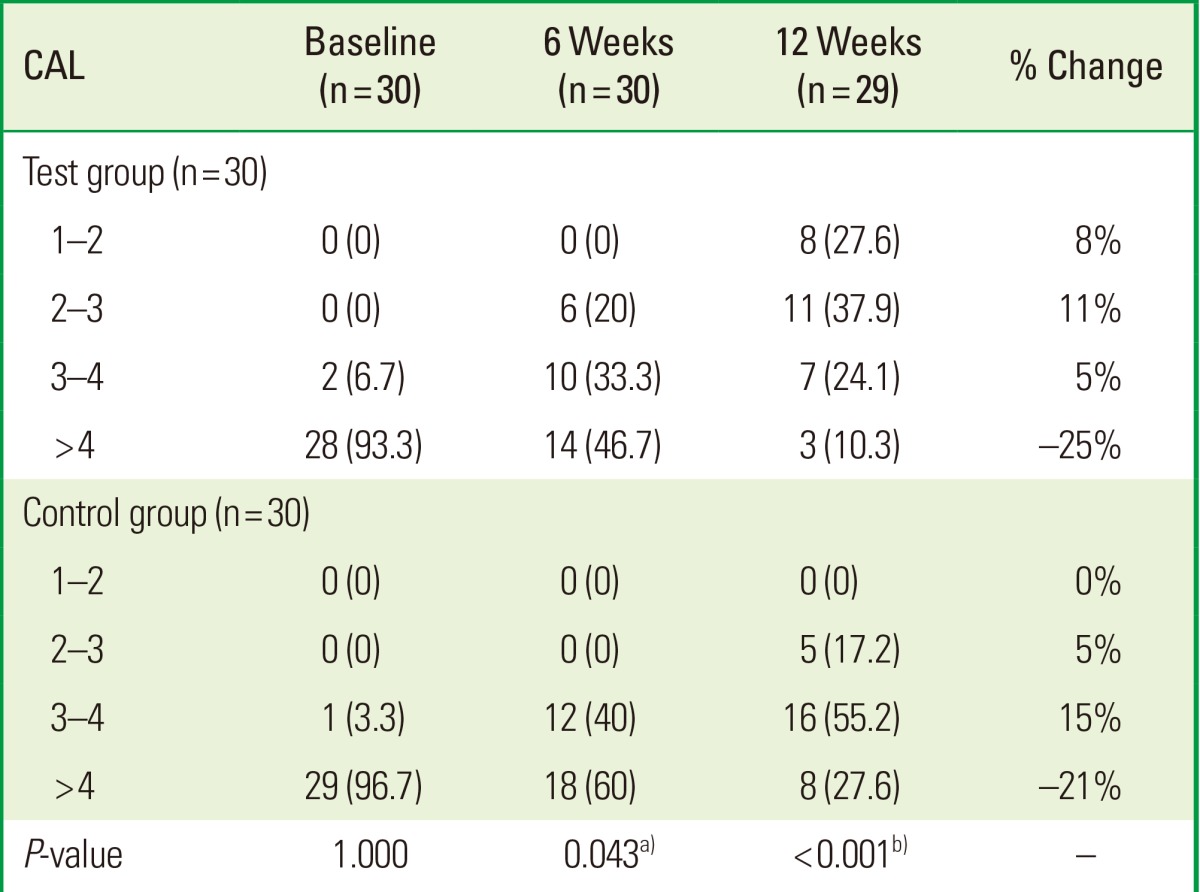
Table 3.
Categorical analysis of clinical attachment level (CAL) in two groups in three different time periods

Values are presented as number (%).
a)Moderately significant (0.01<P≤0.05). b)Strongly significant (P≤0.01).
Categorical analysis of clinical attachment level (CAL) in two groups in three different time periods

Values are presented as number (%).
a)Moderately significant (0.01<P≤0.05). b)Strongly significant (P≤0.01).