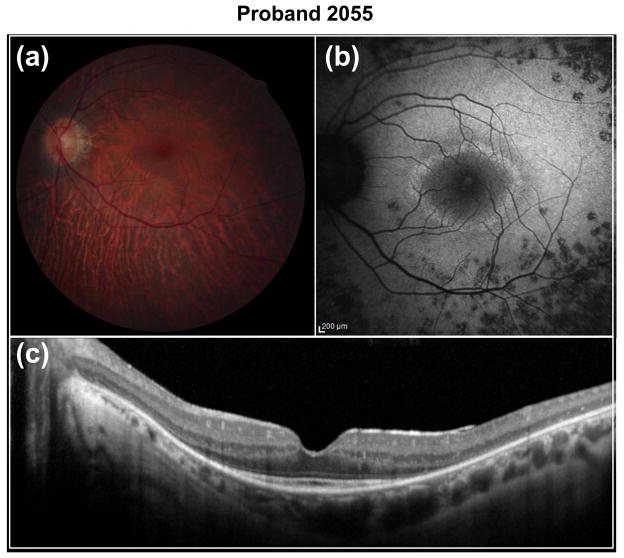
Fig. 6.
Fundus images of proband 2055. Shown are (a) fundus photograph, (b) fundus autofluorescence (FAF) and (c) optical coherence tomography (OCT) images. The retinal photograph of the OS shows mild choroidal sclerosis and peripheral pigment mottling. FAF shows a central hyper-fluorescent ring surrounded by essentially normal FAF, surrounded by mottled FAF outside the arcades. OCT shows extensive IS/OS junction loss, except in the fovea

