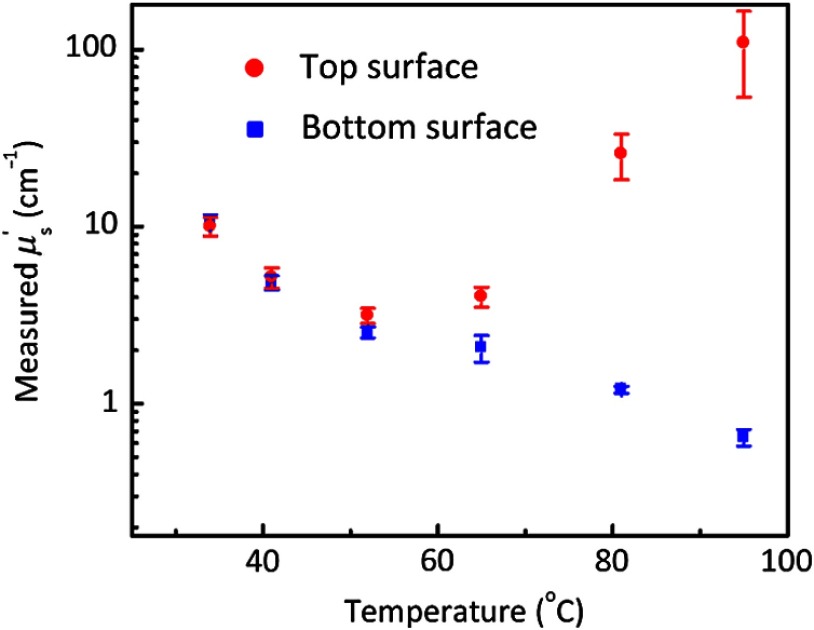
Fig. 5.
Measured reduced scattering coefficients for Group 2 samples, which were prepared with different mixing temperatures but the same duration (30 min). For each phantom, both the top (red circles) and bottom (blue squares) surfaces were examined. On each surface, five measurements were performed at five different locations, from which a mean value was obtained as the mean for that surface. The standard deviation is represented by the error bars.

