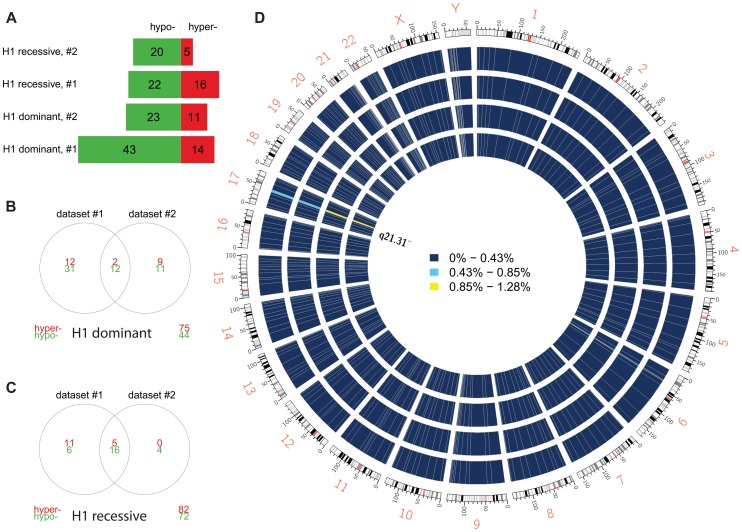
Figure 2. Differential methylation analysis by 17q21.31 haplotype.
(a) Number of DMPs (Benjamini-Hochberg-adjusted p-value ≤0.05) identified in each comparison and each dataset. Dominant: dominant model (H1H1+H1/H2 vs. H2/H2); recessive: recessive model (H1H1 vs. H1/H2+H2/H2). (b) Overlap between datasets #1 and #2 (dominant model). (c) Overlap between datasets (recessive model). (d) Circos plot showing the physical density across the genome of DMPs. Each chromosome was divided in 10 regions, and the proportion of DMPs was assessed. Regions were colored according to the DMP density. Blue: low DMP density, yellow: high density. Circles from inner to outer represent Dataset #2, recessive model; Dataset #1, recessive model; Dataset #2, dominant model; Dataset #1, dominant model. DMPs were mostly enriched in chr17q21.31.

