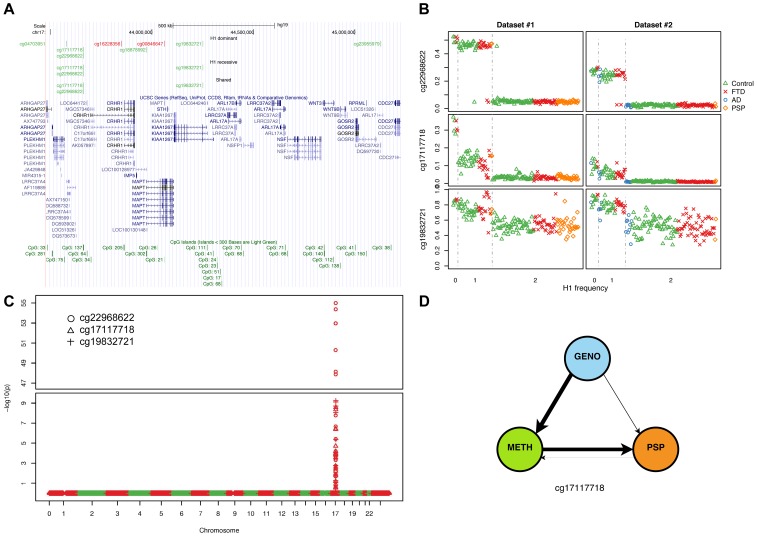
Figure 3. Methylation-QTL at 17q21.31.
(a) Physical position of top (BH adjusted p-value ≤0.05, absolute average beta difference (aβD)>0.1) DMPs identified when comparing samples based on 17q21.31 haplotype. Dominant: dominant model (H1H1+H1/H2 vs. H2/H2); recessive: recessive model (H1H1 vs. H1/H2+H2/H2); Shared: DMPs shared between the two previous comparisons. Red: hypermethylated, Green: hypomethylated. (b) Scatterplot of the methylation levels of 3 top DMPs identified from both H1 dominant and recessive model. (c) Methylation-QTL analysis performed in 226 individuals of European descent on 3 the top DMPs identified when comparing H1 vs. H2 haplotypes. Manhattan plot representing p-values by chromosome. At each genomic location the smaller −log10 p-value from two datasets was plotted. A single cluster at 17q21.31 was identified for all three DMPs. (d) Results of network edge orienting (NEO) analysis for the differentially methylated probe cg17117718 following the mediation model (GENO causes METH causes PSP). The arrow line thickness is proportional to the likelihood that the edge is oriented in the causal direction, found by calculating the relative probability of the model likelihoods determined by NEO.

