Figure 5.
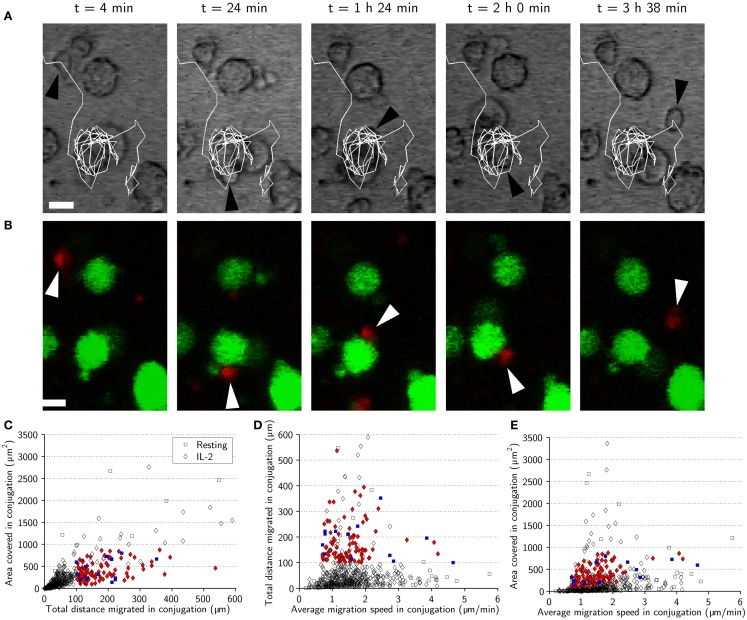
Natural killer cell motile scanning of the target-cell surface. (A) Time-lapse sequence showing an IL-2-activated NK cell (black arrowhead) scanning the surface of a target cell. The images are overlaid with a trace of the NK cell trajectory (white) showing that the NK cell moves several laps around the target cell before detaching. Scale bars indicate 10 μm. (B) Fluorescence images corresponding to (A) showing the fluorescently labeled NK cell (red, white arrowhead) and target cells (green). Both transmitted-light and fluorescence images have been resampled. (C) Total distance migrated in conjugation plotted vs. area covered in conjugation for resting (squares) and activated (diamonds) NK cells indicating the conjugation periods fulfilling the three criteria (blue squares and red diamonds for resting and activated NK cells, respectively). (D) Average migration speed in conjugation plotted vs. total distance migrated in conjugation for resting (squares) and IL-2-activated (diamonds) indicating motile scanning behavior (colored symbols). (E) Average migration speed in conjugation plotted vs. area covered in conjugation indicating motile scanning behavior (colored symbols).

