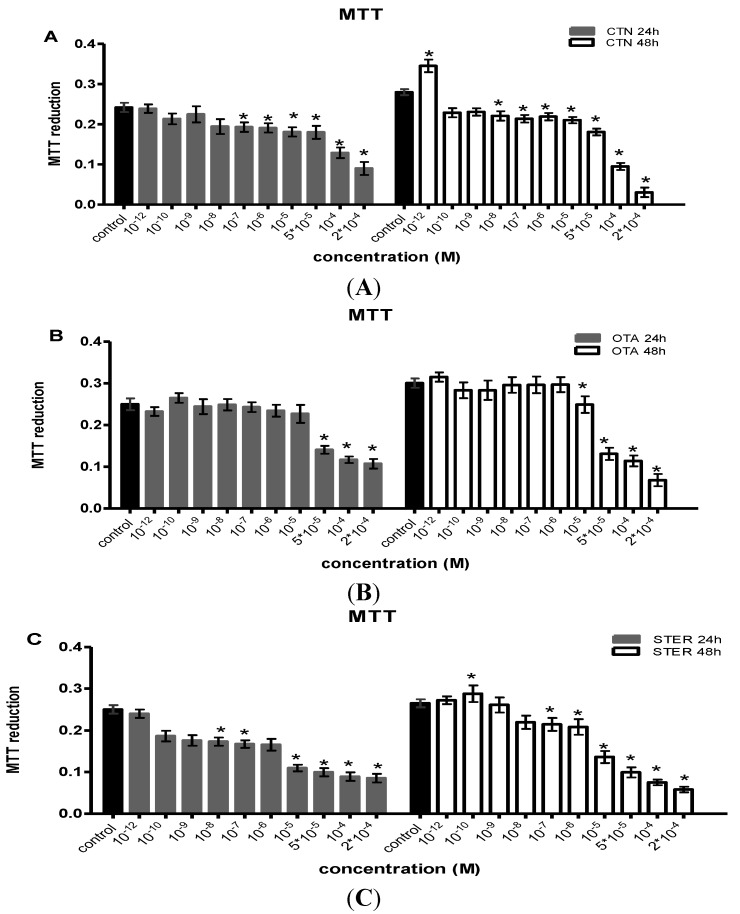
Figure 1.
MTT reduction as a measure of metabolic activity in Hep3B cells after single administration of (A) citrinin (CTN) (B) ochratoxin Α (OTA) and (C) sterigmatocystin (STER), for 24 h and 48 h; Bars represent mean values of every concentration at each time point, which was evaluated at three individual experiments, performing measurements at a number of 8-plicates each time (8-plicates, n = 3).
Note: Error bars give the standard error (SE) between the replicates (n = 3). The asterisks represent statistically significant differences over the respective vehicle-treated cells (control) ( * p < 0.01).

