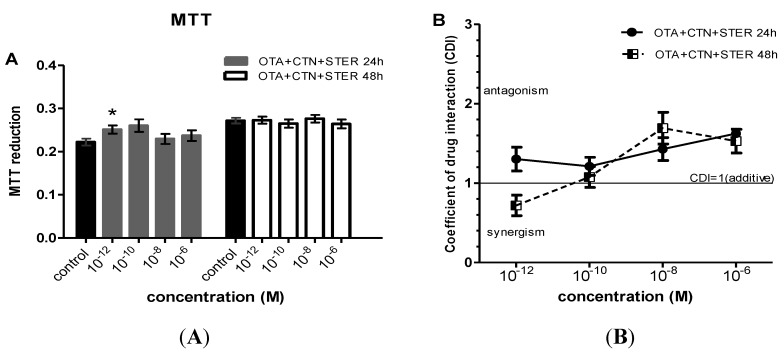
Figure 3.
Evaluation of MTT activity in Hep3B cells after co-administration of (A) CTN, OTA and STER for 24 and 48h; Bars represent mean values of every concentration at each time point, which was evaluated at three individual experiments, performing measurements at a number of 8-plicates each time (8-plicates, n = 3). Error bars give the standard error (SE) between the replicates (n = 3). The asterisks represent statistically significant differences over the respective vehicle-receiving cells (control) (* p < 0.01). CDI values (CDI = 1 CDI < 1 and CDI > 1, shows additive, synergic and antagonistic action respectively) after co-administration of (B) CTN, OTA and STER. Again error bars give the standard error (SE) between the replicates (n = 3).

