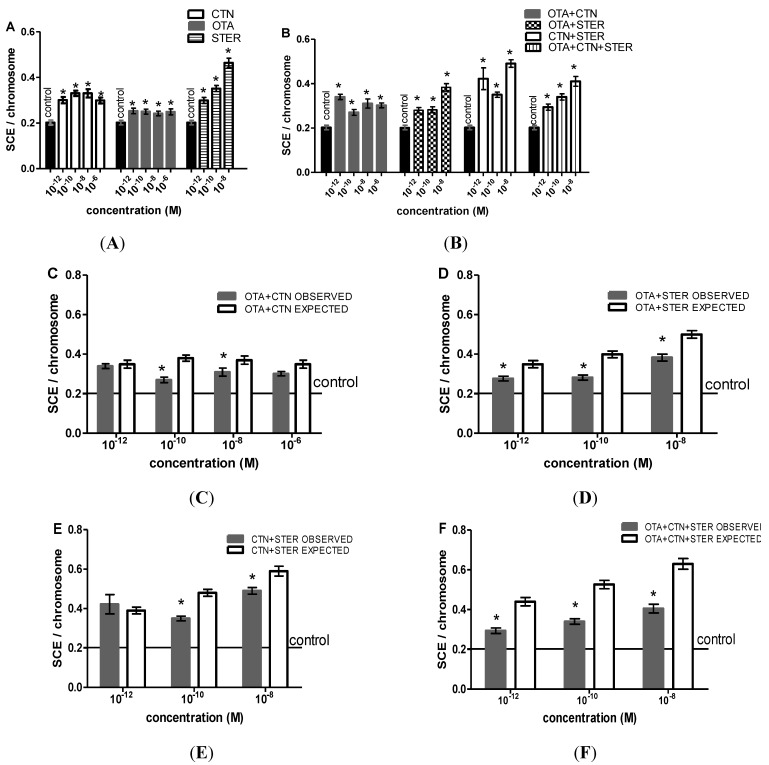
Figure 4.
SCE rates after (A) single CTN, OTA or STER administration, (B) CTN, OTA and STER co-administration. STER at 10−6 M was highly cytotoxic. Bars represent mean ± SEM. All treatments were tested in three independent experiments and approximately 60–75 2nd division metaphases were scored for each treatment. The asterisks indicate statistically significant differences over vehicle-treated cells (p < 0.01). Expected versus observed SCE rates for (C) OTA + CTN, (D) OTA + STER, (E) CTN + STER and (F) OTA + CTN + STER treatments. EV = (OV1 + OV2 + OV3) – (N − 1) × OVcontrol, where EV is the expected value of the combined treatment of N substances, OV is the mean observed value of each individual treatment of N substances and OVcontrol is the mean observed value in control cultures. OV = EV, implies an additive, OV > EV, implies a synergistic and OV < EV, implies an antagonistic effect. The asterisks indicate statistically significant differences between OV and ΕV (p < 0.05).

